Join Our Telegram channel to stay up to date on breaking news coverage
Bitcoin (BTC) Price Prediction – February 22
Bitcoin price is now showing signs of market correction as its price moves below $57,000 to touch the low of $52,576.
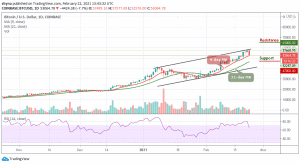
BTC/USD Long-term Trend: Bullish (Daily Chart)
Key levels:
Resistance Levels: $65,000, $67,000, $69,000
Support Levels: $47,000, $45,000, $43,000

BTC/USD is trading around $53,064 above the 9-day and 21-day moving averages. Despite the retracement, Bitcoin (BTC) has remained in a bullish zone and it is likely to continue lower towards $52,000. The king coin is now plunging below the former resistance level of $54,000 which may cause many investors to take profits off the table.
Would Bitcoin (BTC) Go Up or Down?
BTC is currently changing hands at $53,064, however, where BTC trends next may partly depend on whether or not buyers can close today’s candle above the $57,000 level. Should in case this comes to play, it may propel prices higher and then traders may expect BTC/USD to rise above $60,000 resistance which could later move towards the potential resistance levels at $65,000, $67,000, and $69,000.
On the other hand, if the Bitcoin price failed to close above the $57,000 resistance level; the price could drop below the 9-day and 21-day moving averages. A further low drive could send the price to $47,000, $45,000, and $43,000 supports. Meanwhile, the technical indicator RSI (14) has recently revealed a sign of trend reversal as the signal line shows a possible bearish momentum below 65-level.
BTC/USD Medium – Term Trend: Bullish (4H Chart)
Looking at the hourly chart, following the rejection of $57,577, BTC/USD is trading below the $52,000 resistance level. Looking at it from above, if the Bitcoin holds above $53,000, then the next level of resistance could be $55,000, along with the significant mentioned ascending trend-line. The next resistance would be $57, 000 followed by $59,000 and $61,000.
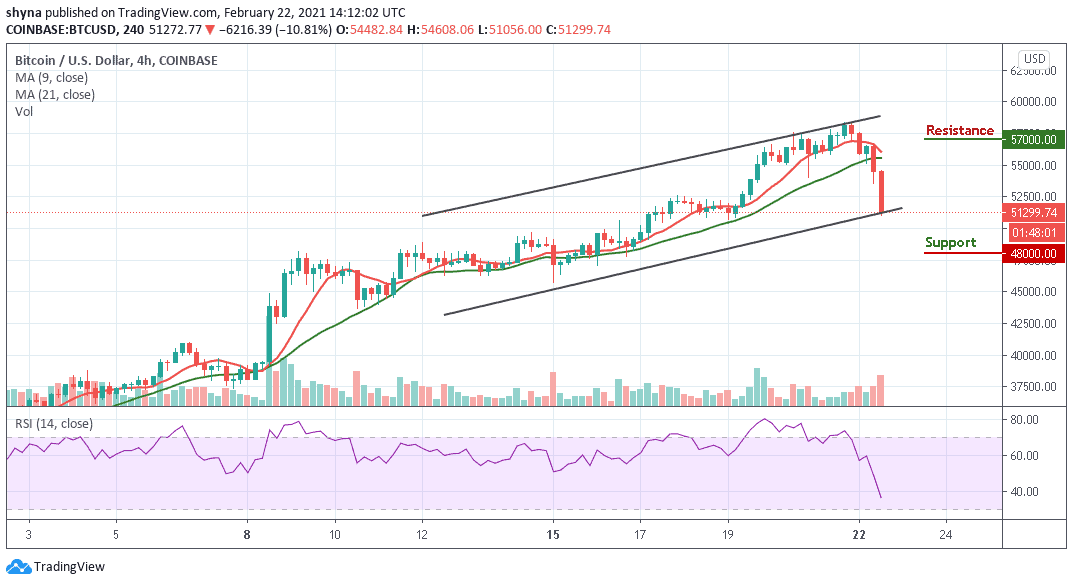
Meanwhile, as the technical indicator moves below the 40-level, this might have signaled a temporary end to the bullish trend of Bitcoin for a moment. However, if the coin falls below the lower boundary of the channel, the market price may likely reach the support levels of $48,000, $46,000, and $44,000 respectively.
Join Our Telegram channel to stay up to date on breaking news coverage