Join Our Telegram channel to stay up to date on breaking news coverage
Bitcoin (BTC) Price Prediction – February 12
Bitcoin price is now showing signs of market correction as its price moves below $48,000 to touch the low of $46,845.
BTC/USD Long-term Trend: Bullish (Daily Chart)
Key levels:
Resistance Levels: $54,000, $56,000, $58,000
Support Levels: $42,000, $40,000, $38,000

BTC/USD is currently trading below the $47,500 level as the price crosses below the upper boundary of the channel. However, the consolidation could be coming to an end according to the technical indicator which indicates that the king coin might likely drop more before climbing higher again.
What to Expect from Bitcoin (BTC)
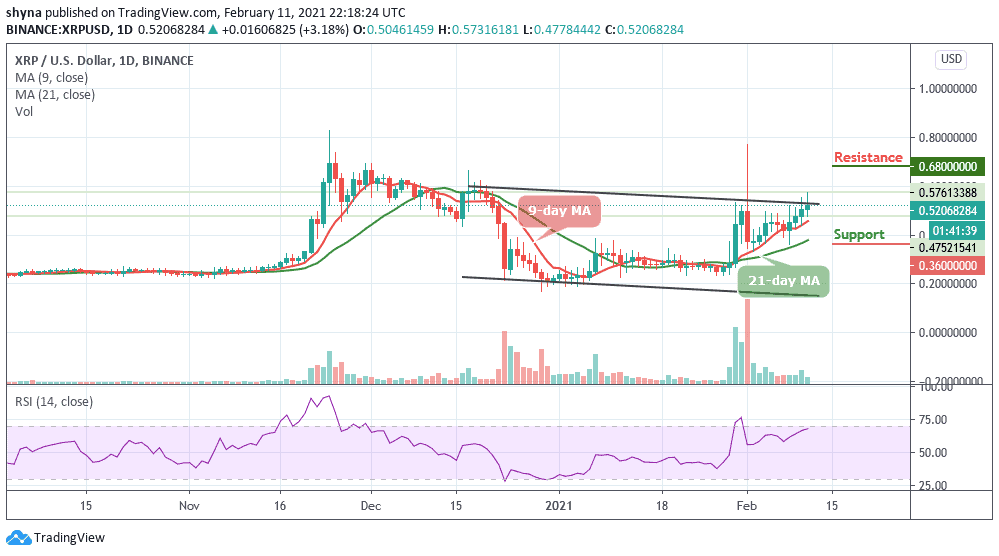
Presently, BTC is changing hands at $47,148, which marks a significant rally below the channel. However, where BTC trends next may depend on whether or not sellers can close today’s candle below the $47,000 level. However, should in case this comes to play, it may definitely propel prices lower. More so, looking at the daily chart, traders expect BTC/USD to fall below $45,000 support which could later move towards the critical support levels at $42,000, $40,000, and $38,000.
On the other hand, if the Bitcoin price failed to close below the $47,000 level; the price may remain above the 9-day and 21-day moving averages. More so, crossing above the upper boundary of the channel could send the price to $54,000, $56,000, and $58,000 resistance levels. Within the overbought region, the technical indicator RSI (14) recently reveals a sign of trend reversal, which shows a possible bearish momentum in the market soon.
BTC/USD Medium – Term Trend: Bullish (4H Chart)
On the 4-hour chart, BTC/USD is currently trading around $47,778 above the 9-day and 21-day moving averages after a reversal from $48,912 where the market touched today as the Bitcoin price is now moving towards the south.
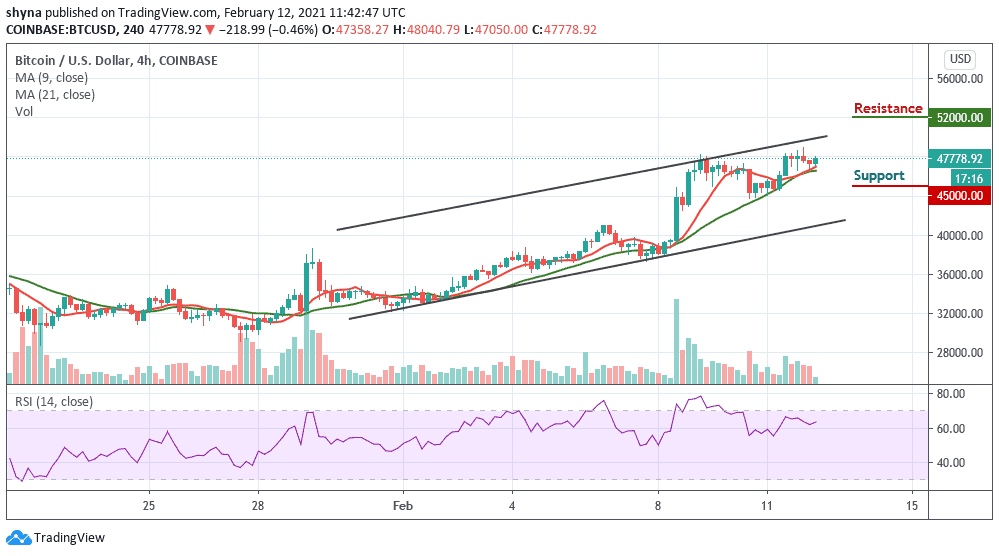
However, if buyers could energize the market, they can further push the price above the upper boundary of the channel and this could push the market price towards $52,000 and above. The RSI (14) is currently moving above 62-level, but any bearish movement to the south may bring the price to the support level of $45,000 and below.
Read more:
- BTCUSD Is Trending Downwards and This May Continue
- Dash Price Prediction for Today, 14 November: DASH Decreases to Test $31 Support Level
Join Our Telegram channel to stay up to date on breaking news coverage