Join Our Telegram channel to stay up to date on breaking news coverage
The Bitcoin price prediction shows that BTC is trading at $21,293 as the coin seems to be preparing for another upward movement.
Bitcoin Prediction Statistics Data:
- Bitcoin price now – $21,293
- Bitcoin market cap – $407.6 billion
- Bitcoin circulating supply – 19.1 million
- Bitcoin total supply – 19.1 million
- Bitcoin Coinmarketcap ranking – #1
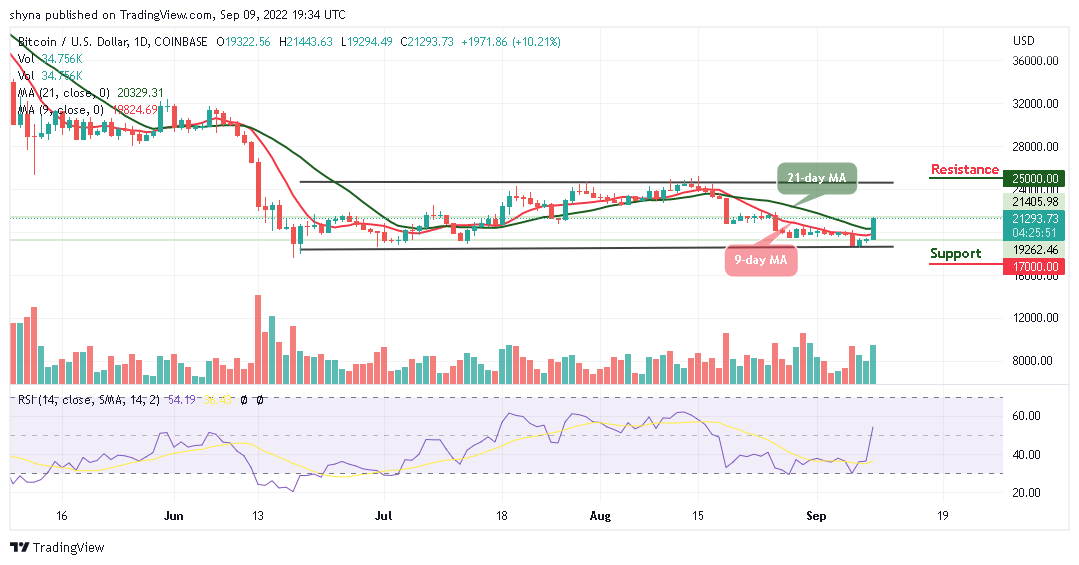
BTC/USD Long-term Trend: Ranging (Daily Chart)
Key levels:
Resistance Levels: $25,000, $27,000, $29,000
Support Levels: $17,000, $15,000, $13,000
Your capital is at risk
BTC/USD is trading above the 9-day and 21-day moving averages at $21,293 as the coin prepares to gain additional higher levels. At the time of writing, the first digital coin is likely to extend towards the resistance level of $22,000 if the bulls put more pressure on the market.
Bitcoin (BTC) May Cross Above $21,500; Tamadoge (TAMA) More Preferable
At the moment, the Bitcoin price is heading towards the upside, any further bullish movement towards the upper boundary of the channel may locate the potential resistance levels at $25,000, $27,000, and $29,000. Usually, when new uptrends are coming up, traders may use the moving averages to gauge the strength of the trend. Nevertheless, if BTC/USD soars to the upper boundary of the channel, this could be a sign of sustainability and may likely result in a bullish continuation.
Furthermore, if the Bitcoin price fails to move up; traders may see a price cut below the lower boundary of the channel, and a further low could bring the price to the support levels at $17,000, $15,000, and $13,000 respectively. But as it stands, the Bitcoin price is likely to rise as the technical indicator Relative Strength Index (14) moves to cross above the 60-level.
BTC/USD Medium-term Trend: Ranging (4H Chart)
According to the 4-hour chart, the market is following a sideways movement above the 9-day and 21-day moving averages as the bulls are coming back into the market to push the king coin above the upper boundary of the channel. If not, the support level of $20,000 and below may come into play.
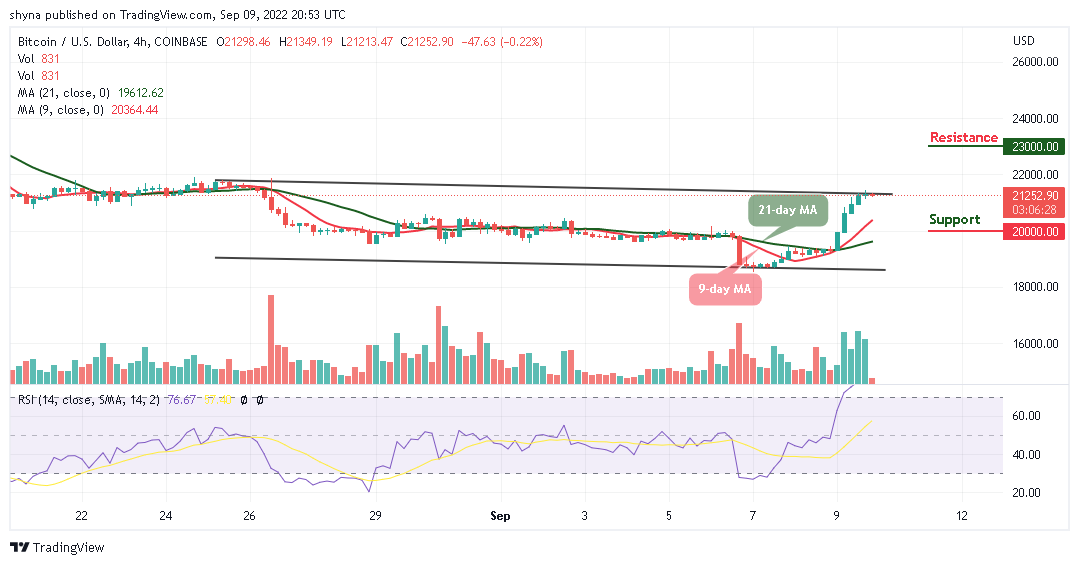
However, suppose the bulls push the market above the channel. In that case, traders may expect a retest of the $22,000 resistance level, breaking this level may further push the price towards the resistance level of $23,000 and above as the technical indicator Relative Strength Index (14) remains within the overbought region, which is suggesting a bullish signal.
Tamadoge is combining the fun of Tamagotchi with the play-to-earn mechanics made possible with NFT technology applied to gaming. Earlier this week, the project completed the sixth phase on the project in which the coin was priced from 1 USDT to 44 TAMA. The price has since increased, to 1 USDT buying 40 TAMA. There will be nine tranches of token sales in all, with the price increasing at each stage. 711 million tokens have been sold so far out of a total of 1 billion that is available in the presale out of a total supply of 2 billion.
Related:
Join Our Telegram channel to stay up to date on breaking news coverage