Join Our Telegram channel to stay up to date on breaking news coverage
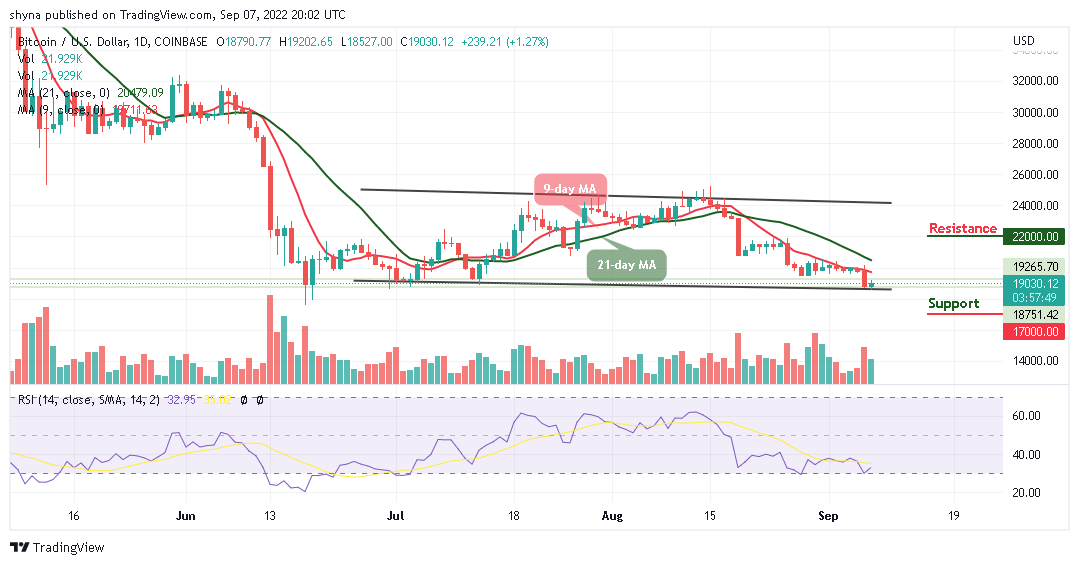
As the daily chart reveals, the Bitcoin price is trading above the resistance level of $19,000 as the recovery comes slowly.
Bitcoin Prediction Statistics Data:
- Bitcoin price now – $19,030
- Bitcoin market cap – $364.8 billion
- Bitcoin circulating supply – 19.1 billion
- Bitcoin total supply – 19.1 billion
- Bitcoin Coinmarketcap ranking – #1
BTC/USD Long-term Trend: Ranging (Daily Chart)
Key levels:
Resistance Levels: $22,000, $24,000, $26,000
Support Levels: $17,000, $15,000, $13,000
Your capital is at risk
At the time of writing, BTC/USD is seen trading at $19,030 after soaring towards the 9-day and 21-day moving averages at the time of writing. The first digital asset is also seen pulling back to where it is currently trading and may head downwards if the bears step back into the market.
Bitcoin (BTC) Faces the North as Tamadoge (TAMA) Trades Bullishly
On the bullish side, the Bitcoin price needs to cross above the moving averages and head towards the upper boundary of the channel, otherwise, there may come a bearish breakdown should it cross below the lower boundary of the channel. Meanwhile, the 9-day MA is below the 21-day MA, and the technical indicator Relative Strength Index (14) sends moderate signs where an oscillation to the higher boundary may confirm the proper trend, which is more likely a bullish trend at the time of the outcome.
However, BTC/USD may confirm the bullish trend if the market price moves above $19,500. On the contrary, the Bitcoin price may follow the bearish trend if the price stays below the moving averages. Should this happen, the king coin may slide to the supports of $17,000, $15,000, and $13,000. Otherwise, a strong bullish spike may push the price towards the resistance levels of $22,000, $24,000, and $26,000.
BTC/USD Medium-term Trend: Bearish (4H Chart)
The 4-hour chart reveals that Bitcoin (BTC) is currently trading above the 9-day moving average. If the price continues to rise further and moves towards the upper boundary of the channel, it could reach the nearest resistance level at $20,000 and above.
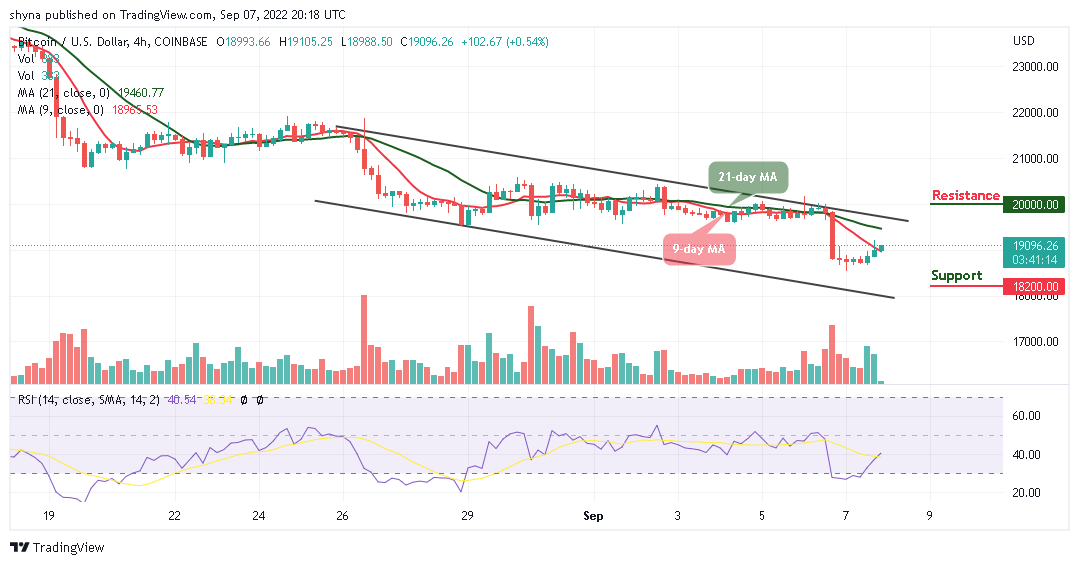
In other words, if the bears bring the price below the lower boundary of the channel, it could reach the closest support at $18,200 and below. Now, the technical indicator Relative Strength Index (14) is crossing above the 40-level, suggesting bullish movement within the market.
Tamadoge is combining the fun of Tamagotchi with the play-to-earn mechanics made possible with NFT technology applied to gaming. Earlier this week, the project completed the sixth phase on the project in which the coin was priced from 1 USDT to 44 TAMA. The price has since increased, to 1 USDT buying 40 TAMA. There will be nine tranches of token sales in all, with the price increasing at each stage. 711 million tokens have been sold so far out of a total of 1 billion that is available in the presale out of a total supply of 2 billion.
Related:
Join Our Telegram channel to stay up to date on breaking news coverage