Join Our Telegram channel to stay up to date on breaking news coverage
After a successful break above $21,500, the Bitcoin price prediction extended its recovery to touch the daily high at $21,818.
Bitcoin Prediction Statistics Data:
- Bitcoin price now – $21,564
- Bitcoin market cap – $414.1 billion
- Bitcoin circulating supply – 19.1 billion
- Bitcoin total supply – 19.1 billion
- Bitcoin Coinmarketcap ranking – #1
BTC/USD Long-term Trend: Ranging (Daily Chart)
Key levels:
Resistance Levels: $25,000, $26,000, $27,000
Support Levels: $19,000, $18,000, $17,000
Your capital is at risk
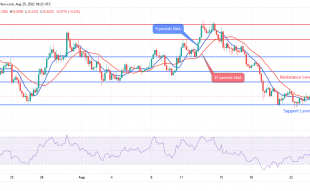
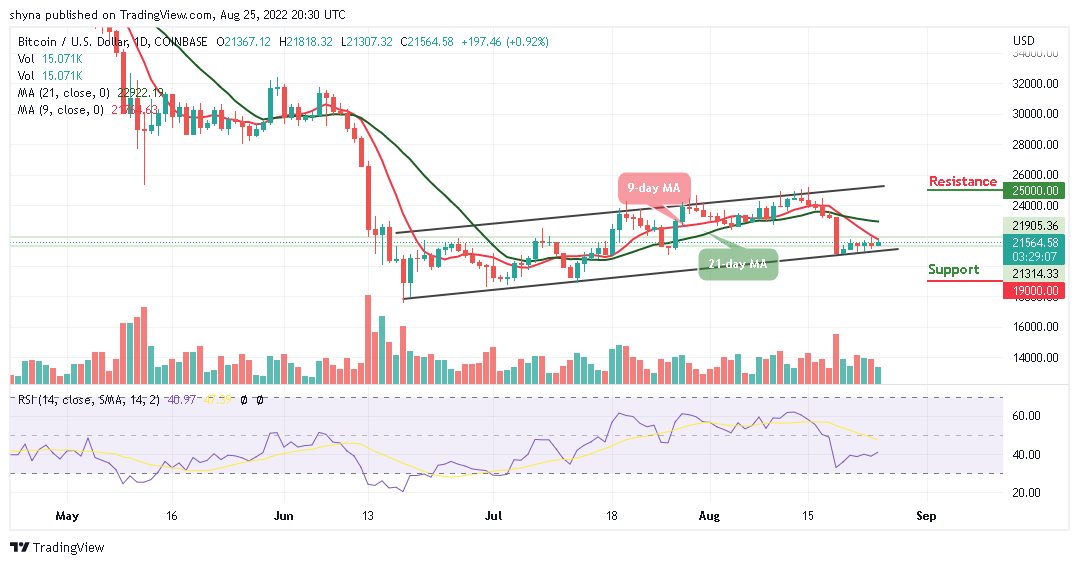
For the past few days, BTC/USD has been ranging in the crypto market as the price trades around the $21,564 level. The Bitcoin price is still hovering below the 9-day and 21-day moving averages and the king coin may head to the north. However, during a short-term breakout, critical support levels must be monitored as the first digital asset is not too far from the lower boundary of the channel.
Would Bitcoin (BTC) Head to the North Just like Tamadoge (TAMA)?
According to the daily chart, the Bitcoin price has increased by 0.92% since the beginning of the day to touch the daily high of $21,818. More so, the first digital cryptocurrency was linked to the early hours of Asia, thus consolidating the gains of the previous session. Therefore, a sustained move above the 9-day moving average could improve the technical situation in the long term.
From above, if there is an upside break above $22,000, the Bitcoin price could recover to $23,000. However, if the price increases and manages to close well above the 9-day and 21-day moving averages, traders could see an upward price explosion towards the potential resistance at $25,000, $27,000, and $29,000 levels as the Relative Strength Index (14) moves above 40-level. Conversely, there could be more losses if there is no break above the $22,000 level and the Bitcoin price may hit the supports at $19,000, $18,000, and $16,000 respectively.
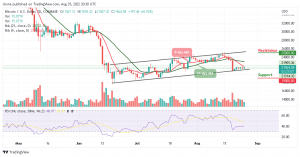
BTC/USD Medium-term Trend: Ranging (4H Chart)
Looking at the 4-hour chart, BTC/USD should recover above $22,000 to mitigate the short-term bearish pressure so that it can allow for an extended recovery towards the resistance level of $24,000 and above. On the other hand, a bearish move below the current market level at $21,000 may open up the way towards the south.
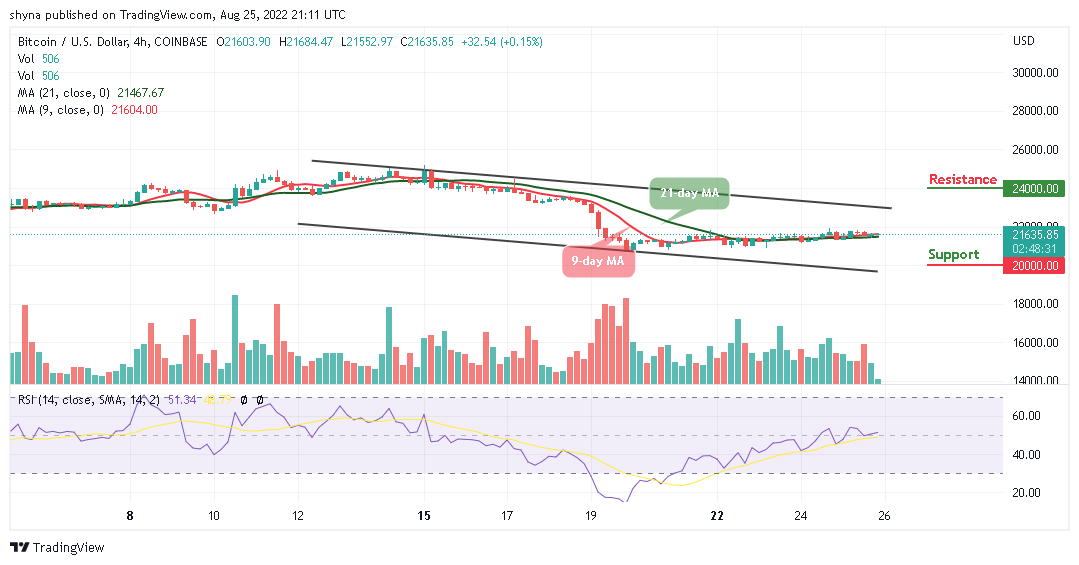
Nevertheless, the critical support could be located below the 9-day and 21-day moving averages, and a sustainable move may bring the price towards the support of $20,000 and below but the Relative Strength Index (14) signal line is above the 50-level, traders might expect few bullish signals within the market.
Tamadoge has assimilated the lessons learned from other projects. Revenue is generated by fees paid on transactions in the Tamadoge NFT Petstore, where players buy clothes, food, and other necessities and discretionary items for their pets. You can own as many pets as you like, with the individual traits of each Tamadoge pet constituted as an NFT.
Related:
- How to Buy Tamadoge
- Visit Tamadoge Website
Join Our Telegram channel to stay up to date on breaking news coverage