Join Our Telegram channel to stay up to date on breaking news coverage
The bears are dominating Shiba Inu market
SHIBUSD Price Analysis – August 25
In case the bulls defend the support level of $0.000012, Shiba Inu may reverse and penetrate $0.000013 upside, $0.000014 and $0.000015 may be reached. Further increase in the bears’ momentum may break down $0.000012, $0.000011 support levels and the support level of $0.000010 may be tested.
Key levels:
Resistance levels: $0.000013, $0.000014, $0.000015
Support levels: $0.000012, $0.000011, $0.000010
SHIBUSD Long-term Trend: Bearish
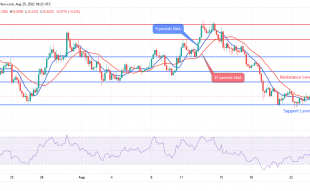
Shiba Inu is on the bearish movement on the daily chart. On August 17, the bullish momentum pushed the price higher to the resistance level of $0.000017 when bulls dominated the Shiba Inu market last two weeks. Bears reacted against this increase and a strong daily bearish candle formed which made the coin decrease to $0.000012 support level. The price is consolidating around $0.000013 level.
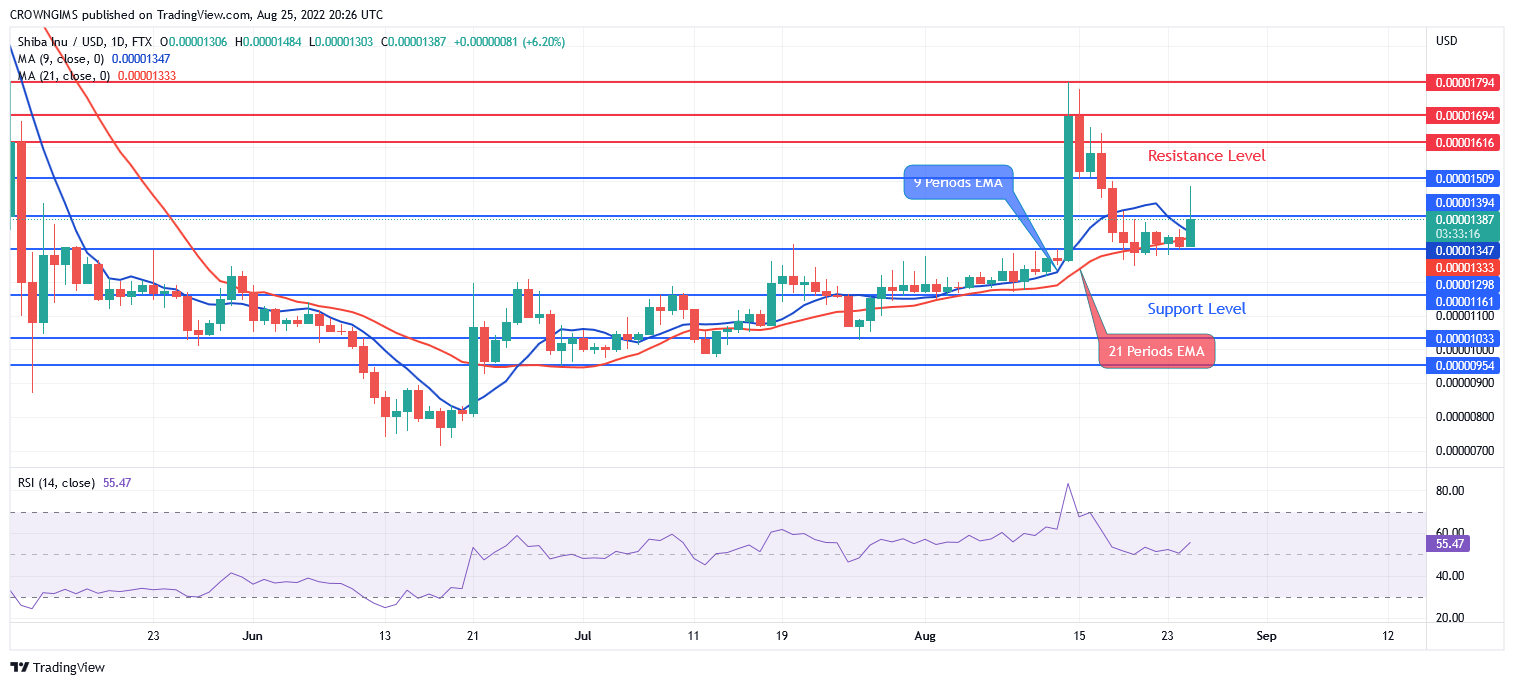
The fast Moving Average (9 periods EMA) remains above the slow Moving Average (21 periods EMA) and the price is trading slightly above the two EMAs as a sign of bearish movement. In case the bulls defend the support level of $0.000012, price may reverse and penetrate $0.000013 upside, $0.000014 and $0.000015 may be reached. Further increase in the bears’ momentum may break down $0.000012, $0.000011 support levels and the support level of $0.000010 may be tested. However, the relative strength index period 14 is at 55 levels pointing up to indicate buy signal.
Your capital is at risk
SHIBUSD medium-term Trend: Bearish, There Is a Bullish Signal for Tamadoge
Shiba Inu is bearish in the 4-hour chart. Last two weeks, the resistance level of $0.000017 was reached when the bullish trend commenced. There was a sharp declination of the price due to opposition from the bears. Price fell to $0.000013 and it started a consolidating movement within the $0.000013 and $0.000014 levels.
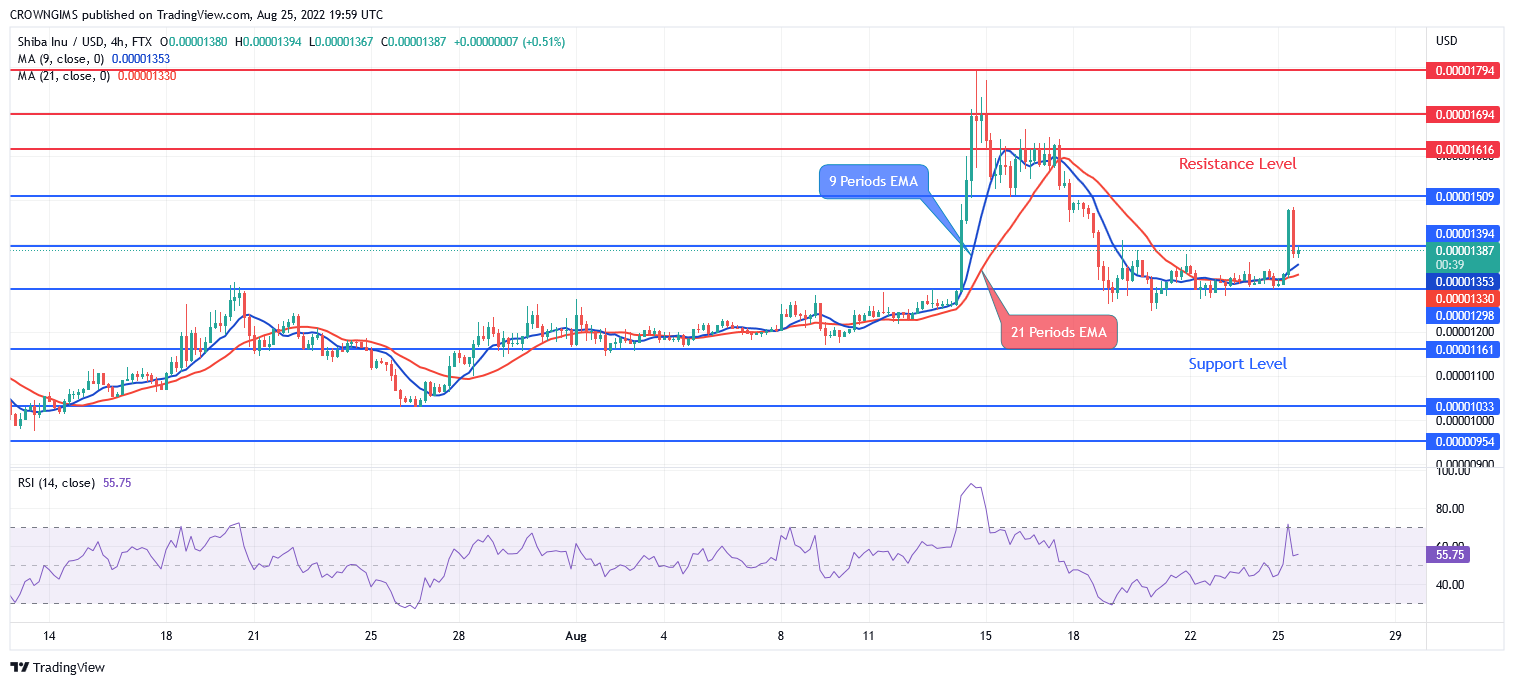
The currency is trading above the 21 periods EMA and 9 periods EMA and the two EMAs are close to each other which indicates a low bullish momentum in Shiba Inu market. The relative strength index period 14 is at 56 levels and the signal lines is exhibiting sell signal.
Tamadoge sold for 1 USDT to 100 TAMA (1 TAMA = 0.01) in the first phase, in which a beta sale of 200 million tokens were made available to the public. Since then there have been successive sale tranches of 100 million tokens. Half of the tokens on offer in the presale have now been sold. In total 1 billion TAMA tokens are up for sale, with the price rising on each occasion. TAMA has a total supply of 2 billion, so early bird buyers in the presale are able to purchase a generous 50% of supply. Tranche prices will keep rising until the price reaches $0.03, equivalent to 3 times the initial beta sale price. The next price to beat is in the sixth phase when 1 USDT buys 44.44 TAMA.
Related
Join Our Telegram channel to stay up to date on breaking news coverage