

Join Our Telegram channel to stay up to date on breaking news coverage
The leader of all cryptocurrency Bitcoin has experienced a sharp price drop, falling to a two-month low of $26,378.
This plunge comes after the tweet from a notable crypto trader, Peter Brandt, warning about a potential drop for Bitcoin.
This warning was enough to trigger bearish market sentiment among investors and traders. As the price remains unstable at the moment, traders are taking a cautious approach to trading the asset.
Liquidations Trigger Bitcoin and Ethereum Price Drops
Two of the largest cryptocurrencies by market capitalization, Bitcoin and Ethereum, have dropped by more than 4% over the past 24 hours.
This decline comes in the wake of recent reports that over $142 million worth of cryptocurrencies, including Bitcoin, Ethereum, and even the meme coin PEPE, have been liquidated in the market.
Bitcoin, in particular, has been on a downward trend since May 10, following a lower-than-expected CPI report that suggested the Federal Reserve may put its rate hikes on hold.
After that peak, it is possible that traders started locking their realized profits from the market and began to sell their BTC to avoid loss.
Besides, a respected and well-recognized commodity trader in the cryptocurrency industry, Peter Brabdt, tweeted that a Head & Shoulder pattern is forming on the Bitcoin chart. This indicates a possible bearish sentiment.
Furthermore, he stressed that if the pattern formed completely, Bitcoin would plunge. This recent price fluctuation and liquidation have sparked speculations among investors and traders about the future price actions of cryptocurrency.
Bitcoin (BTC) Technical Analysis Using Indicators
Currently, the 24H trading volume of BTC is down by 24.1%, with an estimated market cap of about $1 trillion. The price of Bitcoin has increased by 1.2% in the last 24 hours, with a Dominance of 44.4%.
According to the Fear and Greed indicator, the Bitcoin (BTC) current market sentiment is neutral, with a reading of 48.
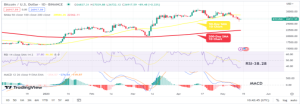
The chart above shows that BTC trades slightly below its 50-day Simple Moving Average (SMA). This indicates that the market is experiencing short-term bearish momentum.
However, the 200-day Simple Moving Averages suggest that the long-term bullish momentum is still on as the market remains above the moving average.
Bitcoin’s Relative Strength Index of 38.28 shows that the bears are building momentum, sending the coin toward the oversold region.
The Moving Average Convergence Divergence (MACD) confirms the bearish pressure as its trading below the signal line. Also, the histogram shows red below zero, validating bearish movement in the market.
Resistance and Support levels
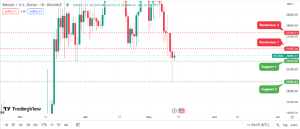
Based on the chart above, Bitcoin has support levels of $26,703 & $25,946. Similarly, Bitcoin resistance levels are at $27, % $27,744.
Currently, the coin is trading at the support and resistance levels of $26,703 & $27,152, respectively. With strong bullish momentum, Bitcoin might rebound and hit the strong resistance at $27,744.
Conversely, the bearish trend might continue if the bears increase the pressure.
But note that several factors affect the price of a cryptocurrency asset. Therefore, technical indicators should be used in conjunction with other factors.
Read more:
- Peter Brandt Calls on SEC to Classify XRP as a Security
Join Our Telegram channel to stay up to date on breaking news coverage