Join Our Telegram channel to stay up to date on breaking news coverage
Bitcoin (BTC) Price Prediction – July 31
The Bitcoin price continues to test the $11,400 level, leading top crypto to believe a rally to $12,000 could occur soon.
BTC/USD Long-term Trend: Bullish (Daily Chart)
Key levels:
Resistance Levels: $12,300, $12,500, $12,700
Support Levels: $10,300, $10,100, $9,900
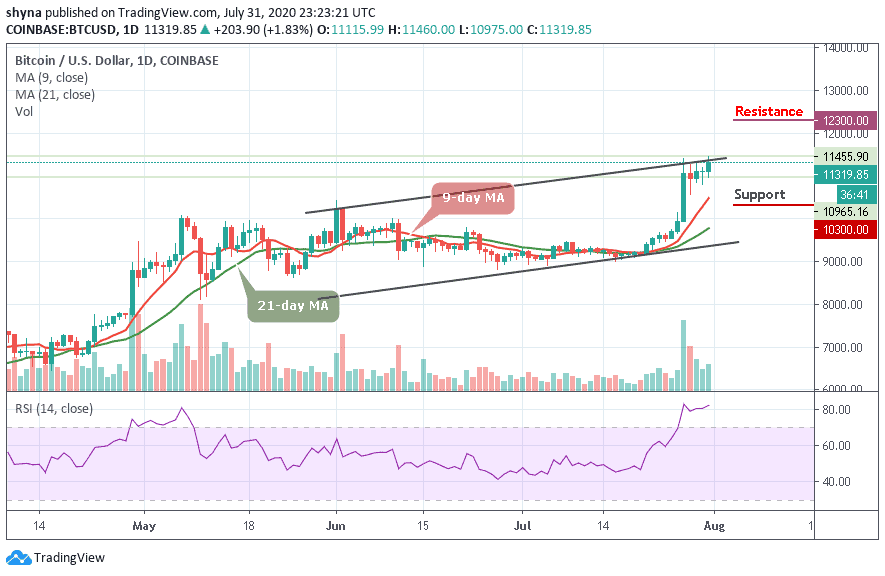
BTC/USD surpassed $11,400 for the third time in three days, breaching a critical resistance level. Earlier today, the Bitcoin price reached $11,455 but it quickly rejected back to the $11,250 range. Meanwhile, within the last hour, the Bitcoin price has risen above the $11,400 mark again and some traders believe that repeated retests of the resistance could raise the chances of a breakout.
However, if the Bitcoin price breaks out of $11,400 resistance level, a rally to $12,000 is likely. At the moment, the resistance range from $11,200 to $11,400 is seemingly triggering sellers to defend this level and prevent a major breakout. Meanwhile, BTC/USD and the daily candle is trading at $11,319, if the bulls could push the price above the channel, the next resistance levels may be found at $12,300, $12,500, and $12,700.
Nevertheless, any failure by the bulls to push the price above the channel could bring the price to $10,300, $10,100, and $9,900 supports. For now, the bulls are still dominating the market. But as things stand, the Bitcoin price could reverse again because the technical indicator RSI (14) may be getting ready to move out of the overbought condition.
BTC/USD Medium-Term Trend: Bullish (4H Chart)
On the 4 hour chart, BTC/USD is trading at $11,349 as all eyes are glued on the $11,500 resistance level. Looking at the chart currently, the coin is seen moving towards the upper boundary of the channel while the existing trend is still bullish.
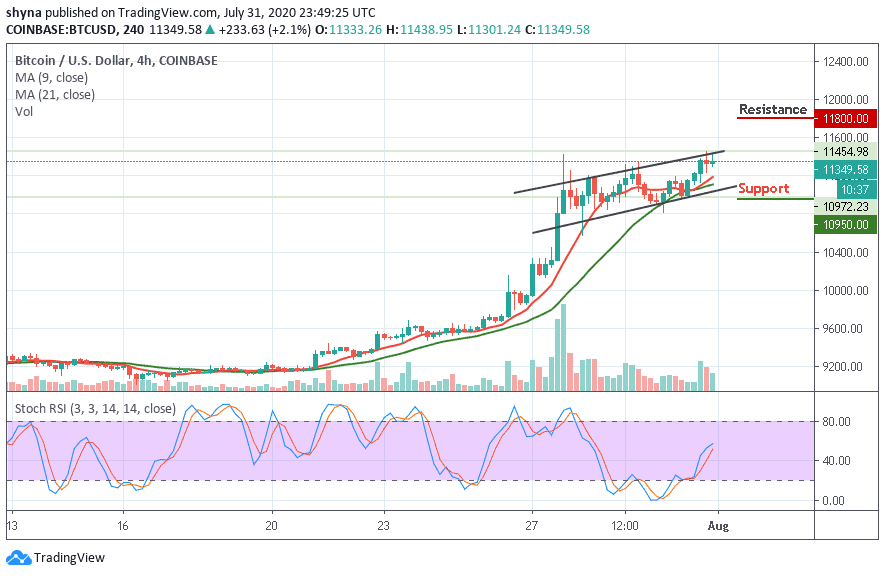
However, at the time of writing, the Bitcoin price is recovering above $11,300 level amidst fresh buying impetus. More so, the bullish trend line remained unbroken, which is why Bitcoin’s priority still remains the same and the coin may likely touch the $11,500 mark next. Meanwhile, if the technical indicator stochastic RSI continues to follow the upward movement, the coin may likely reach the resistance level of $11,800 and above while the support level to watch lies at $10,950 and below.
Join Our Telegram channel to stay up to date on breaking news coverage