
Join Our Telegram channel to stay up to date on breaking news coverage
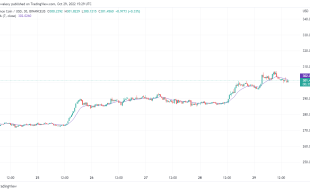
As the Bitcoin price prediction shoots above $20,500, the bulls are ready to push the king coin to touch the resistance level of $21,000.
Bitcoin Prediction Statistics Data:
- Bitcoin price now – $20,656
- Bitcoin market cap – $396.9 billion
- Bitcoin circulating supply – 19.1 million
- Bitcoin total supply – 19.1 million
- Bitcoin Coinmarketcap ranking – #1
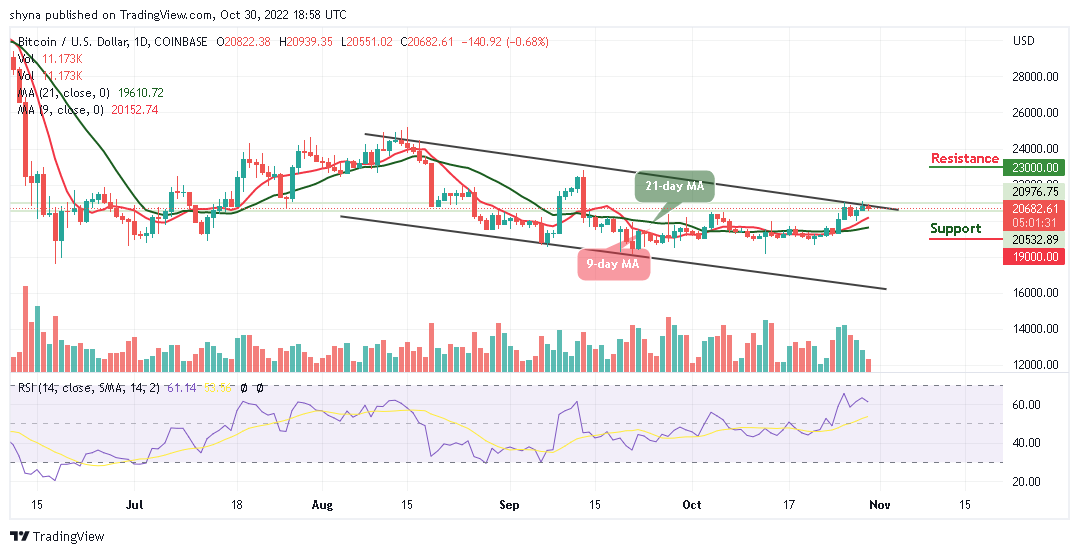
BTC/USD Long-term Trend: Ranging (Daily Chart)
Key levels:
Resistance Levels: $24,000, $25,000, $26,000
Support Levels: $18,000, $17,000, $16,000
BTC/USD is following a bullish movement at the time of writing as the king coin may continue to increase above the 9-day and 21-day moving averages. At the beginning of today’s trading, the Bitcoin price touches the $20,939 resistance level.
Bitcoin Price Prediction: BTC Price Heads to the Upside
The Bitcoin price is seen moving positively as the king coin trades above the 9-day and 21-day moving averages. However, any further increase in the bullish movement could push the current market value to the potential resistance of $22,000. The buyers may then locate the other resistance levels at $23,000, $24,000, and $25,000.
However, if the current market value of $20,682 fails to hold, it may reverse and face the support level of $20,000, further increase in the bears’ pressure may bring the price below the 9-day and 21-day moving averages, and this may cause the coin to hit the support levels at $19,000, $18,000, and $17,000 while the technical indicator Relative Strength Index (14) remains above the 60-level to increase the bullish movement.
BTC/USD Medium-term Trend: Ranging (4H Chart)
According to the 4-hour chart, the Bitcoin price hovers within the 9-day and 21-day moving averages, the bulls may push the price toward the upper boundary of the channel but any bearish cross below the 21-day moving average could bring the coin to the support level of $20,000 and below.
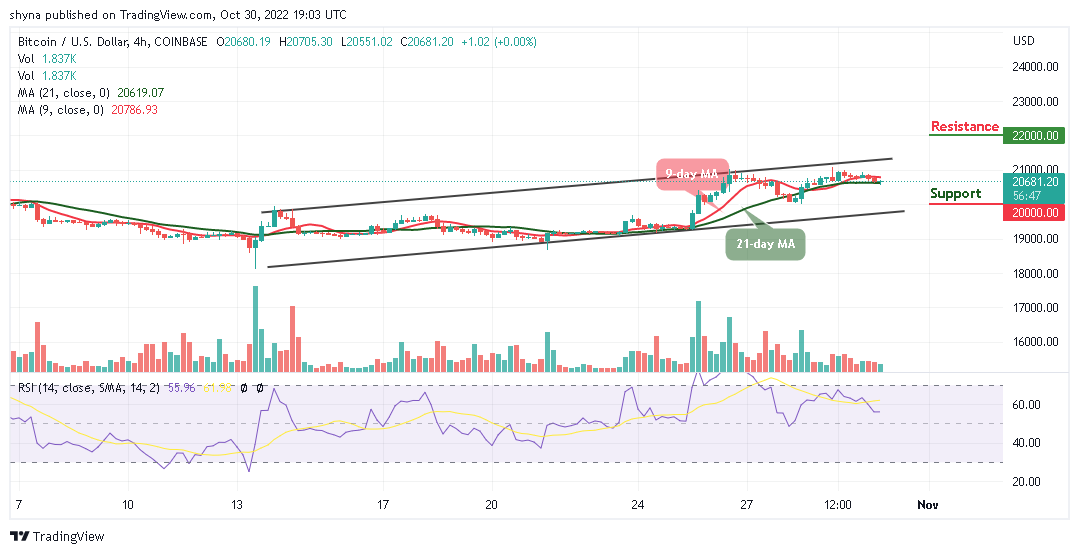
Meanwhile, if the Bitcoin price holds the current market level, it could cross above the upper boundary of the channel to hit the resistance level of $22,000 and above. Now, the technical indicator Relative Strength Index (14) is moving below the 60-level, indicating sideways movement.
The IMPT token presale has been successful as the token raises $10 million in four weeks. This puts the Impact token well on its way to hitting its $10.8 million target for the first stage of the presale.
Dash 2 Trade is a new crypto signals platform that hopes to bring retail trading tools to the masses and has now raised $3 million on its pre-sale to achieve that goal.
Related:
- How to Buy IMPT Token
- How to Buy D2T
Join Our Telegram channel to stay up to date on breaking news coverage