
Join Our Telegram channel to stay up to date on breaking news coverage
The Bitcoin price prediction shows that BTC is trading at $20,656 as the coin seems to be preparing for another upward movement.
Bitcoin Prediction Statistics Data:
- Bitcoin price now – $20,656
- Bitcoin market cap – $396.7 billion
- Bitcoin circulating supply – 19.1 million
- Bitcoin total supply – 19.1 million
- Bitcoin Coinmarketcap ranking – #1
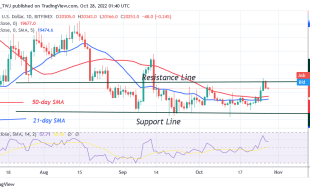
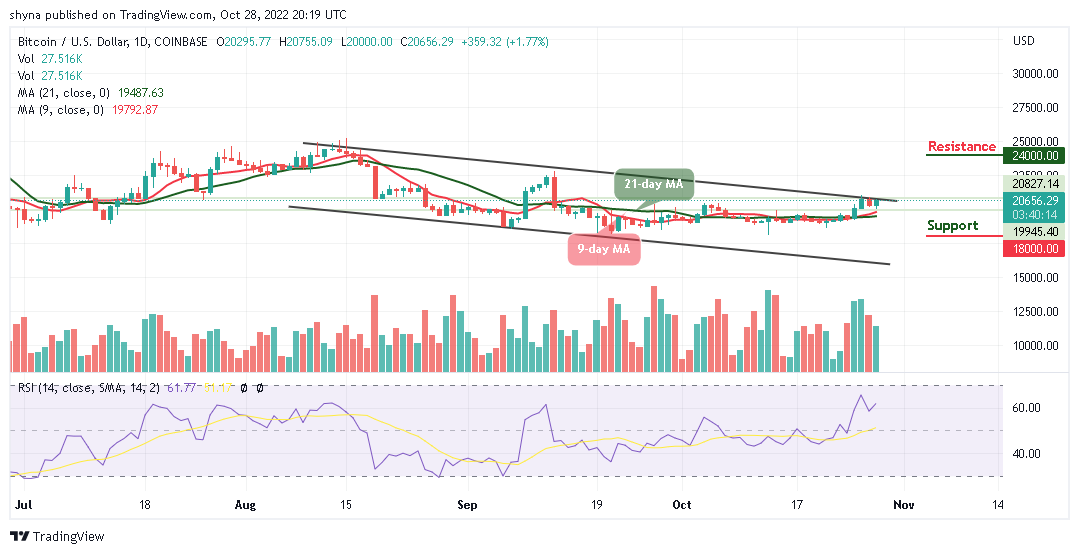
BTC/USD Long-term Trend: Ranging (Daily Chart)
Key levels:
Resistance Levels: $24,000, $25,000, $26,000
Support Levels: $18,000, $17,000, $16,000
BTC/USD is trading above the 9-day and 21-day moving averages at $20,656 as the coin prepares to gain additional higher levels. At the time of writing, the Bitcoin price is likely to extend toward the resistance level of $21,000 if the bulls put more pressure on the market.
Bitcoin Price Prediction: Bitcoin (BTC) May Locate $21,000 Level
At the moment, the Bitcoin price is heading toward the upside, any further bullish movement above the upper boundary of the channel may locate the potential resistance levels at $24,000, $25,000, and $26,000. Normally, when new uptrends are coming up, traders may use the moving averages to gauge the strength of the trend. Nevertheless, if BTC/USD soars above the upper boundary of the channel, this could be a sign of sustainability and may likely result in a bullish continuation.
However, if the Bitcoin price fails to move up; traders may see a price cut below the 9-day and 21-day moving averages, and a further low could bring the price to the support levels at $18,000, $17,000, and $16,000 respectively. But as it stands, the Bitcoin price is likely to rise as the technical indicator Relative Strength Index (14) crosses above the 60-level.
BTC/USD Medium-term Trend: Bullish (4H Chart)
However, suppose the bulls push the market toward the upper boundary of the channel. In that case, traders may expect a retest of the $21,000 resistance level, breaking this level may further push the price towards the resistance level of $22,000 and above as the technical indicator Relative Strength Index (14) remains above 60-level, which is suggesting more bullish signals.
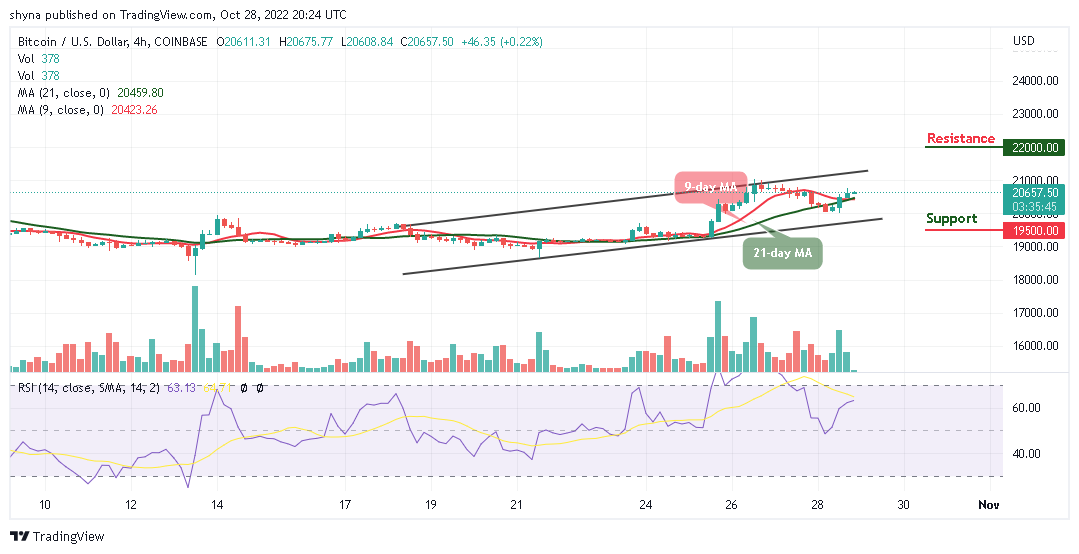
On the contrary, if the bears step back into the market and the king coin slides below the 9-day and 21-day moving averages, crossing below the lower boundary of the channel may locate the support at $19,500 and below.
The IMPT token presale has been successful as the token raises $10 million in four weeks. This puts the Impact token well on its way to hitting its $10.8 million target for the first stage of the presale.
Dash 2 Trade is a new crypto signals platform that hopes to bring retail trading tools to the masses and has now raised $3 million on its pre-sale to achieve that goal.
Related:
- How to Buy IMPT Token
- How to Buy D2T
Join Our Telegram channel to stay up to date on breaking news coverage