Join Our Telegram channel to stay up to date on breaking news coverage
The Bitcoin price prediction slumps below the resistance level of $20,878. Further downside momentum may come to play, but $20,000 may likely come out as support.
Bitcoin Prediction Statistics Data:
- Bitcoin price now – $20,590
- Bitcoin market cap – $395.8 billion
- Bitcoin circulating supply – 19.1 million
- Bitcoin total supply – 19.1 million
- Bitcoin Coinmarketcap ranking – #1
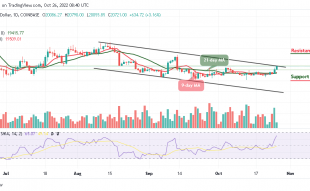
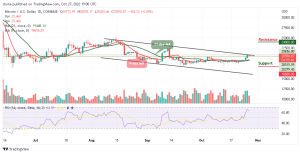
BTC/USD Long-term Trend: Ranging (Daily Chart)
Key levels:
Resistance Levels: $24,000, $25,000, $26,000
Support Levels: $18,000, $17,000, $16,000
BTC/USD range-bounds with the selling pressure seen around the $20,434 level which is stopping it from seeing any major gains. Meanwhile, traders are not surprised by the selling pressure as bears are trying to defend against a break above the upper boundary of the channel. However, until bulls keep the price above this barrier, the Bitcoin price may face a prolonged sideways movement or drop below the current market value.
Bitcoin Price Prediction: Bitcoin May Revisit the $20k Support
The Bitcoin price may likely slide below the 9-day and 21-day moving averages if the bears increase the selling pressure; however, a further retracement seems imminent, and it is likely to break below $20,000. Meanwhile, 18,000, $17,000, and $16,000 serve as the significant support levels, making room for BTC to fall even further. The technical indicator Relative Strength Index (14) is above the 60-level, suggesting bearish movement.
However, as the daily chart reveals, if the bulls could push the price back above the daily high at $20,878, BTC/USD may see a potential resistance level at $21,000, therefore, any further movement towards the upper boundary of the channel could send it to other resistance levels at $24,000, $26,000, and $27,000 respectively.
BTC/USD Medium-term Trend: Bullish (4H Chart)
Looking at the 4-hour chart, the bears are coming back into the market as the market price crosses below the 9-day moving average. The bulls failed to hold the Bitcoin price above the moving averages. On the contrary, if BTC/USD breaks above the channel’s upper boundary, the resistance level of $21,500 and above may come into play.
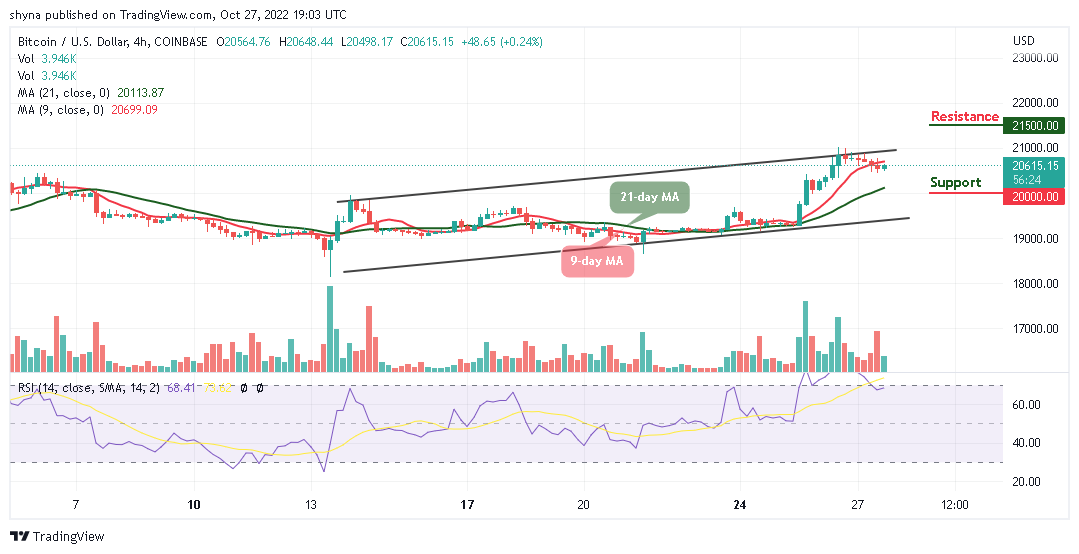
Nevertheless, if the price breaks below the 21-day moving average and heads toward the lower boundary of the channel, the support level of $20,000 and below may be located. Meanwhile, as the Relative Strength Index (14) moves around the 70-level, more bearish signals may play out before a rebound could come in.
The IMPT token presale has been successful as the token raises $10 million in four weeks. This puts the Impact token well on its way to hitting its $10.8 million target for the first stage of the presale.
The Dash 2 Trade presale got off to a flying start, grossing over $2 million within so many days. The presale takes place in nine stages, and the price gradually increases with each stage. The price is now $0.05 on the second leg.
Related:
- How to Buy IMPT Token
- How to Buy D2T
Join Our Telegram channel to stay up to date on breaking news coverage