Join Our Telegram channel to stay up to date on breaking news coverage
The Bitcoin price prediction shows that BTC could retest the $20,500 level for it to experience a steady increase above the moving averages.
Bitcoin Prediction Statistics Data:
- Bitcoin price now – $20,581.73
- Bitcoin market cap – $395.3 billion
- Bitcoin circulating supply – 19.1 million
- Bitcoin total supply – 19.1 million
- Bitcoin Coinmarketcap ranking – #1
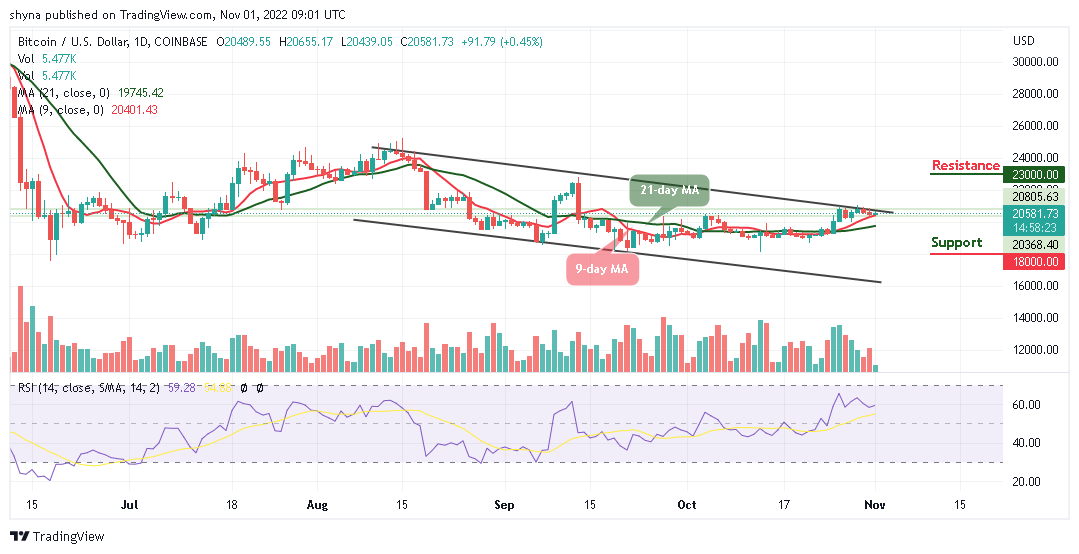
BTC/USD Long-term Trend: Ranging (Daily Chart)
Key levels:
Resistance Levels: $23,000, $24,000, $25,000
Support Levels: $18,000, $17,000, $16,000
BTC/USD is likely to recover higher should in case the bulls hold the price at $20,581 which is the support zone and the first digital asset must cross above the upper boundary of the channel to start another increase. As of the time of this writing, the Bitcoin price still sits above the 9-day and 21-day moving averages.
Bitcoin Price Prediction: Would BTC Gain More?
According to the daily chart, the Bitcoin price could gain more uptrends if it crosses above the upper boundary of the channel. Traders could see that the Bitcoin price converges above the key level of $20,000 and the 9-day MA trend line still remains above the 21-day MA preparing the coin to create more upsides. The Relative Strength Index (14) moves around the 60-level in an attempt to probably cross into the positive side.
Moreover, a clear break above the $21,000 level could set the pace for a larger increase to the $23,000, $24,000, and $26,000 resistance levels. On the contrary, should the Bitcoin price fail to touch the nearest resistance level of $21,000, it could start a new decline and the initial support on the downside could be found below the moving averages. If there is a downside break below this barrier, the King coin could see a sharp decline toward the support levels of $18,000, $17,000, and $16,000 respectively.
BTC/USD Medium-term Trend: Ranging (4H Chart)
According to the 4-hour chart, BTC/USD keeps trading on average as the market begins to show a sign of a bullish trend. However, the intraday trading is likely to follow the bullish movement but any bearish movement below the 9-day moving average could locate critical support at $20,000 and below.
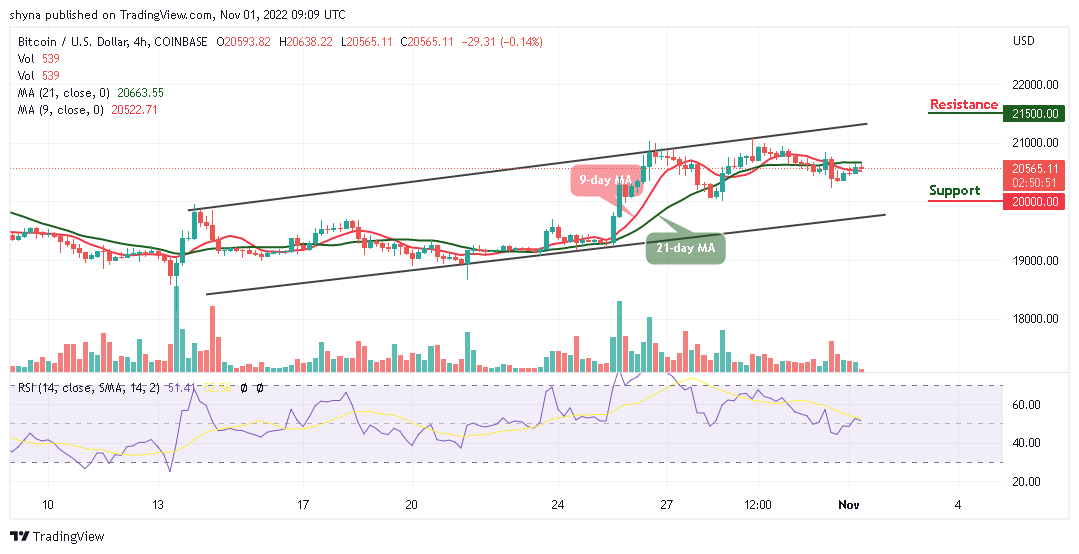
Therefore, considering the recent sharp rebound, a climb above the 21-day moving average may further push the BTC price to the resistance level of $21,500 and above. As it appeared now, it seems the bears may likely return to the market if the Relative Strength Index (14) moves around the 50-level, to indicate a bearish signal.
IMPT is a revolutionary cryptocurrency ecosystem that aspires to go green and contribute to environmental sustainability. The IMPT presale has proven to be one of the biggest and most successful presales of 2022, raising over $11 million in just a few weeks.
The Dash 2 Trade presale has already raised over $3 million in less than 2 weeks of its launch, this happens to be one of the most explosive token sales this year.
Related:
- How to Buy IMPT Token
- How to Buy D2T
Join Our Telegram channel to stay up to date on breaking news coverage