Join Our Telegram channel to stay up to date on breaking news coverage
The Bitcoin price prediction shows that BTC keeps trading below the moving averages as the coin touches $33,701 support.
BTC/USD Long-term Trend: Ranging (Daily Chart)
Key levels:
Resistance Levels: $40,000, $44,000 $46,000
Support Levels: $30,000, $28,000, $26,000
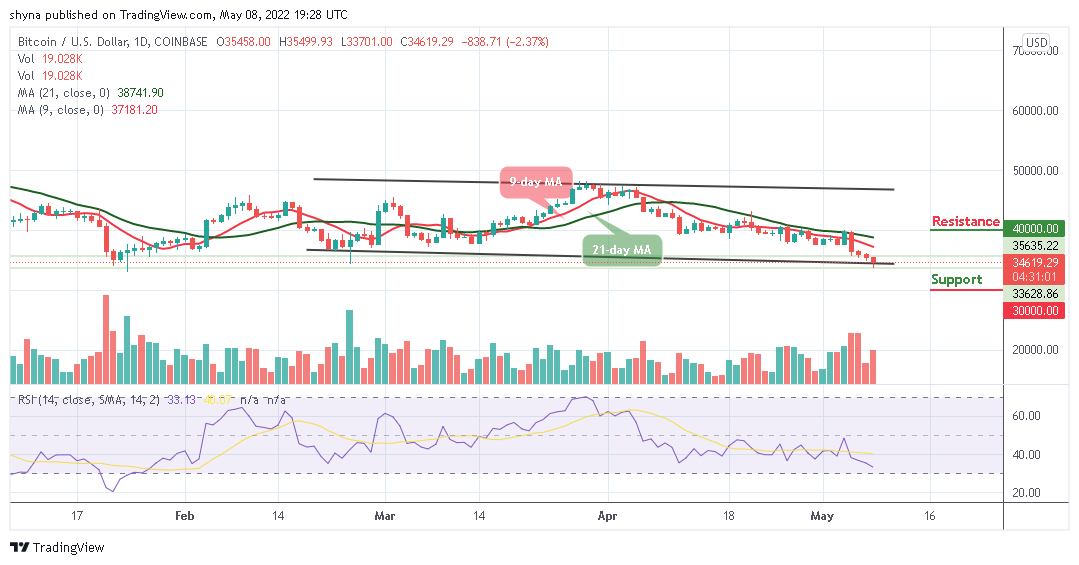
BTC/USD continues to face a setback that could be a permanent one. The king coin is likely to have an additional bearish run but a price rally may help the coin to head to the south as the red line of the 9-day moving average remains below the green line of the 21-day moving average. Currently, Bitcoin (BTC) is trading around the $34,619 level after a free fall from $35,499 during the European.
Bitcoin Price Prediction: Bitcoin (BTC) May Stay Below the Moving Averages
Looking at the daily chart, the Bitcoin price is currently nose-diving below the lower boundary of the channel. If the price should slump below the support level of $34,000, the king coin is likely to face a downward trend. However, the further bearish movement could locate the supports at $30,000, $28,000, and $26,000, making room for BTC to fall even further.
In the meantime, the technical indicator Relative Strength Index (14) is likely to cross into the oversold region as the trading volume could be in support of the bears. Moreover, if bulls decide to move the price above the 9-day and 21-day moving averages, BTC/USD may move towards the upper boundary of the channel to locate the resistance levels at $40,000, $42,000, and $44,000.
BTC/USD Medium-Term Trend: Bearish (4H Chart)
On the 4-Hour chart, the Bitcoin price remains below the 9-day and 21-day moving averages and the immediate support is likely to come at the $34,500 level. The price may likely fall below this level if the bears continue to dominate the market.
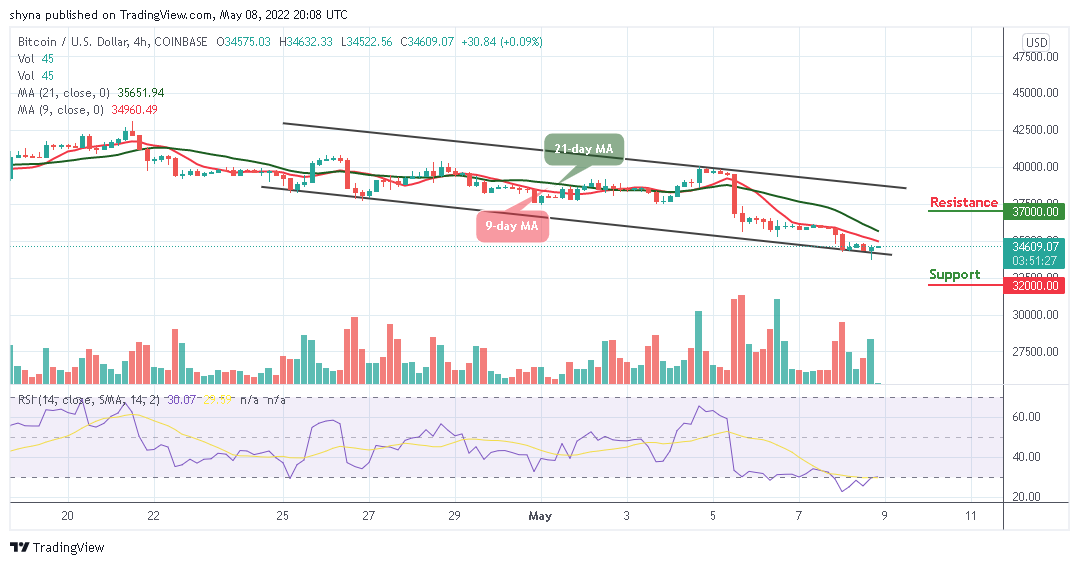
However, a further bearish movement could hit the critical support at the $32,000 level and below while the resistance is located above the moving averages at the resistance level of $37,000 and above. Meanwhile, the Bitcoin price is currently moving on the positive side as the technical indicator Relative Strength Index (14) is likely to leave the oversold region.
Looking to buy or trade Bitcoin (BTC) now? Invest at eToro!
68% of retail investor accounts lose money when trading CFDs with this provider
Read more:
- How to buy Bitcoin
- How to buy Cryptocurrency
Join Our Telegram channel to stay up to date on breaking news coverage