Join Our Telegram channel to stay up to date on breaking news coverage
The Bitcoin price prediction is facing an intense tug of war as bears mount pressure near $35,500, taking the market price to the downside.
BTC/USD Long-term Trend: Ranging (Daily Chart)
Key levels:
Resistance Levels: $42,000, $44,000, $46,000
Support Levels: $30,000, $28,000, $26,000
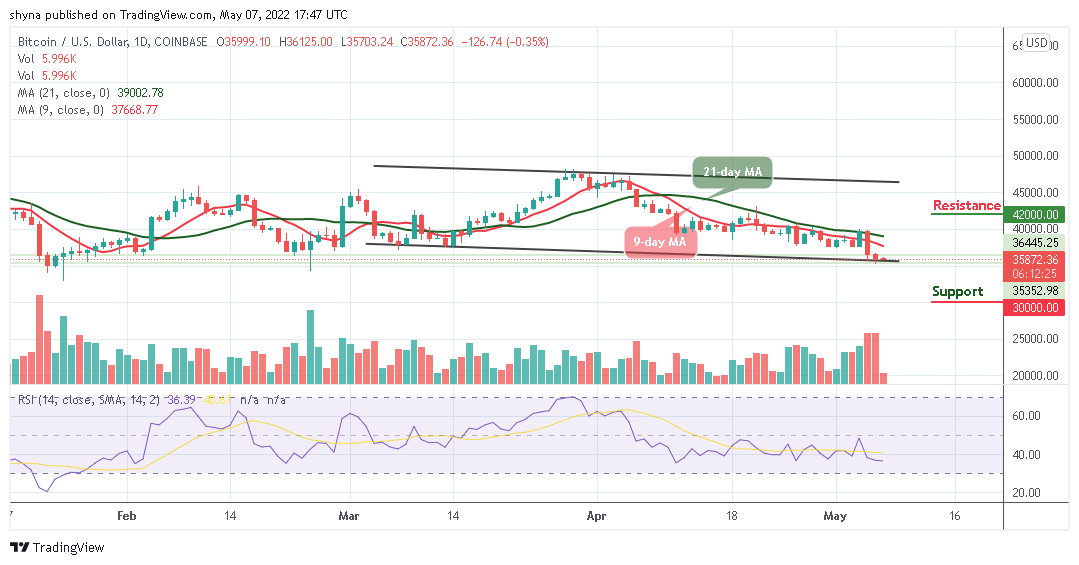
BTC/USD is dropping from the opening price of $35,999 as the bulls are struggling to overcome the important resistance at $36,000. The stagnation near the lower boundary of the channel shows that the pair is unable to increase volume to keep the market to the upside and overcome key hurdles with confidence.
Bitcoin Price Prediction: Bitcoin (BTC) May Range-bound
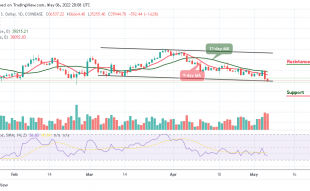
This week, after the Bitcoin price touched the high at $40,000, the king coin has not had much action and it is likely to trade within a range. However, support and resistance levels may ensure that the daily charts are not very volatile. More so, the price may challenge the lower boundary of the channel and could reach the nearest support at the $34,000 level. However, the sudden drop that occurred a few days ago has brought back the bears to touch the low of the $35,255 support zone.
According to the daily chart, the Bitcoin price could not go higher as it is currently dropping below the 9-day and 21-day moving averages. Meanwhile, the candle has not yet close and the bulls are unlikely to close above it. More so, should the technical indicator Relative Strength Index (14) stays below the 40-level, the Bitcoin price may touch the critical supports at $30,000, $28,000, and $26,000 but on the contrary, crossing above the moving averages could meet the potential resistance levels at $42,000, $44,000, and $46,000 respectively.
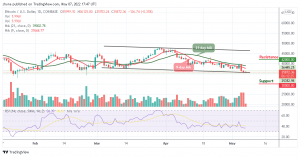
BTC/USD Medium-Term Trend: Bearish (4H Chart)
Looking at the 4-hour chart, the bears are coming back into the market as the bulls failed to defend the $36,000 level. However, the $34,000 and below may come into play if the bearish momentum increases the market movement.
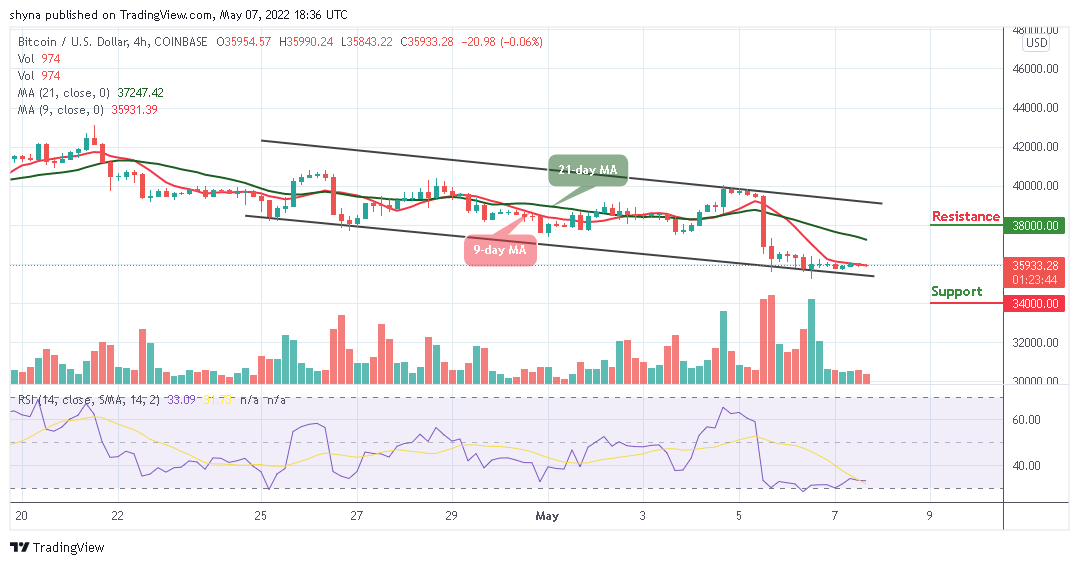
However, if the buyers hijack the current movement and push it above the 21-day moving average, traders may expect a retest at a $37,000 resistance level; breaking this level may further allow the bulls to touch $38,000 and above. At the moment, the Relative Strength Index (14) signal line is moving below the 35-level which could give additional bearish signals in the next negative move.
Read more:
- How to buy Bitcoin
- How to buy Cryptocurrency
Join Our Telegram channel to stay up to date on breaking news coverage