Join Our Telegram channel to stay up to date on breaking news coverage
Bitcoin Price Prediction – June 27
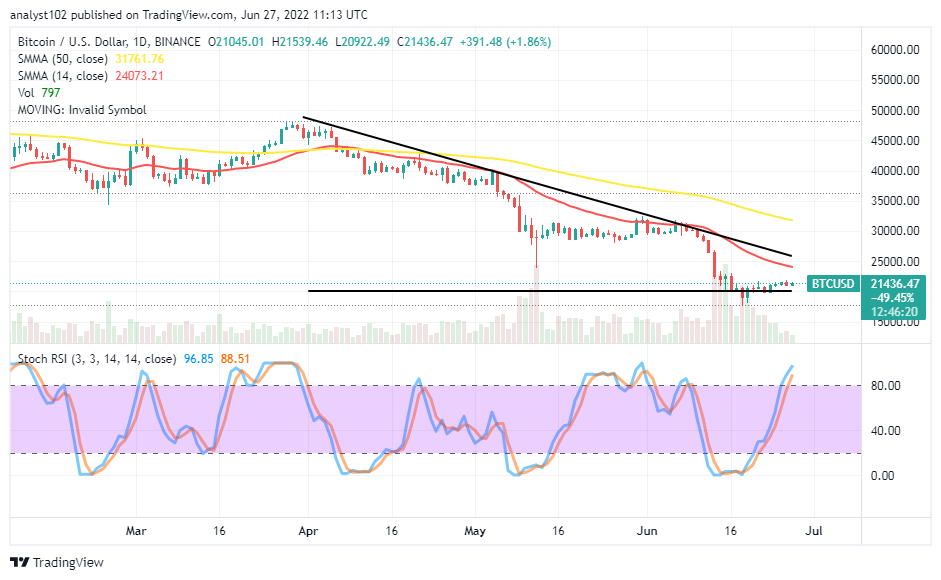
In the BTC/USD market, in the wake of trying to push back northward, the crypto price now hovers over the $20,000 support line. Price currently features between $21,539 and $20,922 at a percentage rate of 1.86.
Bitcoin (BTC) Statistics:
BTC price now – $21,371.91
BTC market cap – $408.8 billion
BTC circulating supply – 19.1 million
BTC total supply – 19.1 million
Coinmarketcap ranking – #1
BTC/USD Market
Key Levels:
Resistance levels: $22,500, $25,000, $27,500
Support levels: $20,000, $17,500, $15,000 BTC/USD – Daily Chart
The daily chart reveals the BTC/USD trade hovers over the $20,000 support level below the trend line of the smaller SMA. The 14-day SMA trading indicator is underneath the 50-day SMA indicator. The bearish trend line drew around the smaller SMA. The Stochastic Oscillators have moved northbound, penetrating the overbought region. And they still pose to suggest that buying force is relatively ongoing.
Where should be the focal resistance in the BTC/USD market?
The focal resistance point in the BTC/USD market operations can be traced upfront by the reading position of the 14-day SMA indicator that has indicated $24,073.21. In other words, the current rallying motion still has the chance to push maximally to the value line before any intensely depressive pressure can make a come-back in the long-term run. An early reversion of the current trading spot may lead the market back into the last lower-trading zone.
On the downside of the technical analysis, as the forces supporting buying orders have been gradually reducing, the BTC/USD market sellers, at this stage, needed to exercise cautiousness before going for a re-launch of the sell order. An area of resistance appears not farfetched from the current trading spot. It may only take more time before degenerating into a downward-trending motion.
BTC/USD 4-hour Chart
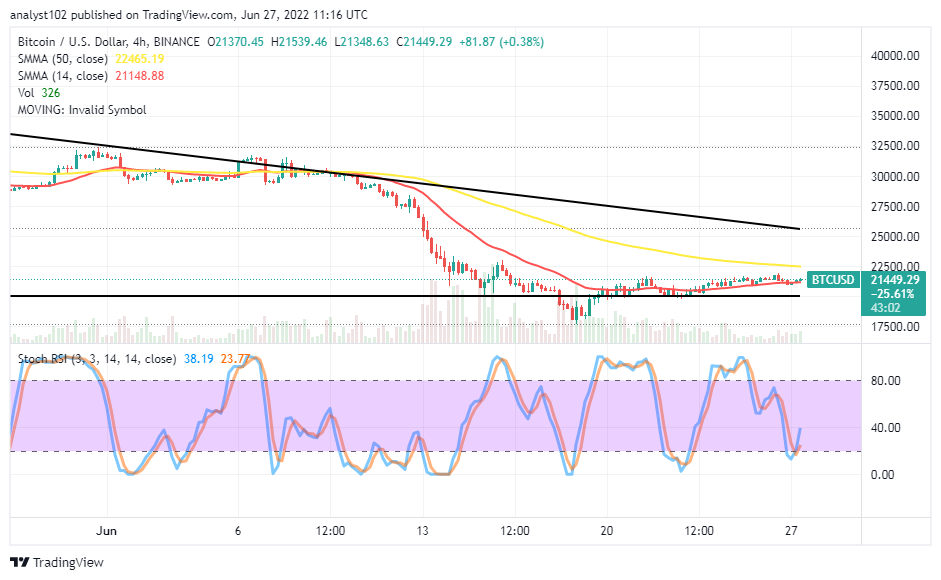
The BTC/USD medium-term showcases the crypto economy hovers over the $20,000, serving as the support baseline upward forces. The 50-day SMA indicator is above the 14-day SMA indicator. The bigger SMA indicated $22,465 as the key area of resistant-trading point against the subsequent buying forces. The Stochastic Oscillators have moved southbound, trying to cross back northbound from the 20 range against the range at 40. The current trading pattern of the candlesticks signifies some tinier lower highs. That tells the market is relatively enjoying some buying pressures.
Looking to buy or trade Bitcoin (BTC) now? In-Content Heroes link!
68% of retail investor accounts lose money when trading CFDs with this provider.
Read more:
Join Our Telegram channel to stay up to date on breaking news coverage


