Join Our Telegram channel to stay up to date on breaking news coverage
Bitcoin Price Prediction – June 23
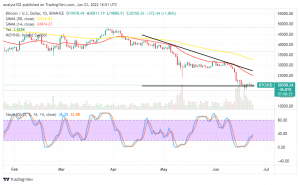
It has now been over a couple of sessions that the BTC/USD market faces fluctuations at $20,000, running into a week. The trade price, as of writing, is trading at $20,811 and $19,880 at a positive percentage rate of 1.86.
Bitcoin (BTC) Statistics:
BTC price now – $20,318.99
BTC market cap – $387.8 billion
BTC circulating supply – 19 million
BTC total supply – 19 million
Coinmarketcap ranking – #1
BTC/USD Market
Key Levels:
Resistance levels: $22,500, $25,000, $27,500
Support levels: $17,500, $15,000, $12,500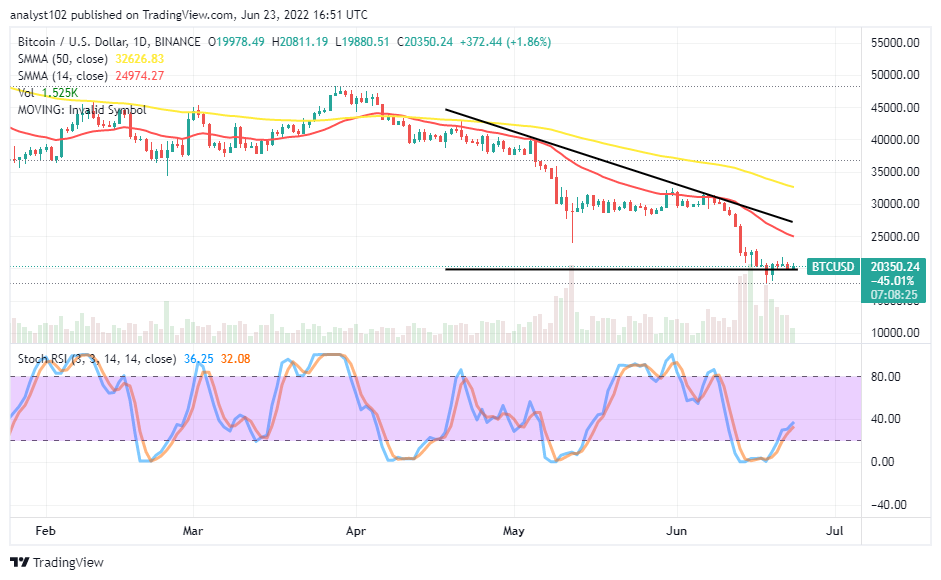 BTC/USD – Daily Chart
The daily chart showcases the BTC/USD market faces fluctuations at a $20,000 trading level. The horizontal line drew at the value line underneath the trend lines of the SMAs. The 14-day SMA indicator is underneath the 50-day SMA indicator. The bearish trend line drew southward closely over the smaller SMA to serve as a backing-resistant trading indicator. The Stochastic Oscillators are in the 20 and 40 range points, seemingly trying to position in a slanting posture. And that can lead to a situation of indecision in the long-term run.
Can there be an indecision trading moment soon in the BTC/USD market as it faces fluctuations?
There can be an indecision trading moment in the following trading sessions, especially if the two major market movers refuse to exert energy that can lead to a definite direction as the BTC/USD market faces fluctuations at the $20,000 level. In the light of the market trying to pull down slightly against the value line, a rebound in the process should not overlook to give back a buying signal. In addition to that effect, long-position takers needed to be wary of exerting new orders while there is no active upward motion to back it.
On the downside of the technical analysis, short-position takers may look out for a return of downward-trending forces under the resistance level of around $25,000, as indicated by the reading of the 14-day SMA indicator. A long-holding situation of price around the $20,000 level may lead the market back to revisit a lower-trading zone. Investors should hold on to their portfolios and can consider buying more if the price goes dipper.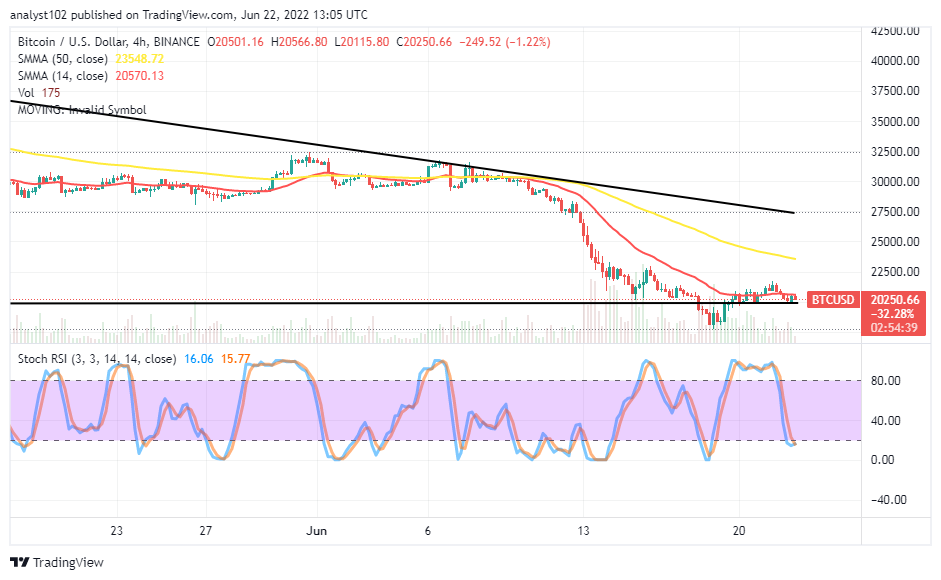
BTC/USD 4-hour Chart
The medium-term chart reveals the BTC/USD market faces fluctuations at $20,000, involving going around the trend line of the smaller SMA. The 50-day SMA indicator is above the 14-day SMA indicator. The Stochastic Oscillators have sprung upward from the oversold region to now attempt closing their lines at the 40 range. The trading situation appears that the market has to continue to find its support depth, possibly below the value line, until it will be able to surge fearfully past it afterward.
Looking to buy or trade Bitcoin (BTC) now? In-Content Heroes link!
68% of retail investor accounts lose money when trading CFDs with this provider.
Read more:
- How to buy Bitcoin
- How to buy cryptocurrency
Join Our Telegram channel to stay up to date on breaking news coverage