Join Our Telegram channel to stay up to date on breaking news coverage
The Bitcoin price prediction shows that BTC is following the sideways movement as the coin fails to head towards the 21-day moving average.
Bitcoin Prediction Statistics Data:
- Bitcoin price now – $21,099
- Bitcoin market cap – $402.1 billion
- Bitcoin circulating supply – 19.0 million
- Bitcoin total supply – 19.0 million
- Bitcoin Coinmarketcap ranking – #1
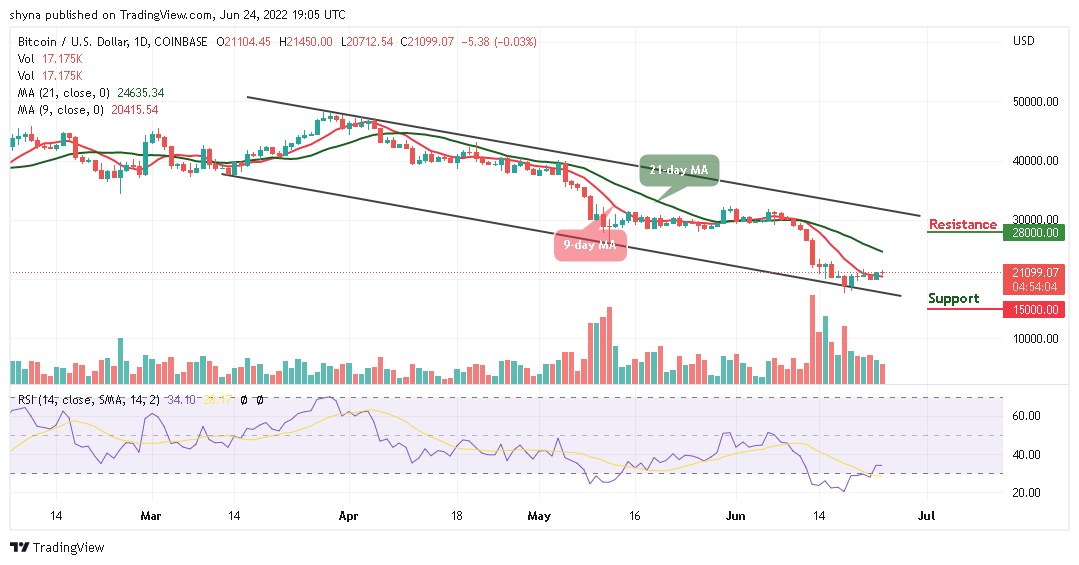
BTC/USD Long-term Trend: Ranging (Daily Chart)
Key levels:
Resistance Levels: $28,000, $30,000, $32,000
Support Levels: $15,000, $13,000, $11,000
At the time of writing, BTC/USD is hovering at $21,099. However, the king coin has not been able to reclaim the resistance level of $22,000 as the coin consolidates within the 9-day and 21-day moving averages. At the moment, the Bitcoin price may begin to follow the sideways movement, but the daily chart shows that the formation of a bearish movement is likely to play out.
Bitcoin Price Prediction: BTC Price May Consolidates to the Downside
As the Bitcoin price moves toward the east, it is likely to slide and face the lower boundary of the channel as the technical indicator Relative Strength Index (14) moves in the same direction below the 40-level. This could mean that the King coin is not yet ready for the upside until the red line of the 9-day moving average crosses above the green line of the 21-day moving average.
Looking at it from above, recovery may not come easy as the bears may bring the king coin below the channel’s lower boundary. Meanwhile, a sustainable move above the 9-day and 21-day moving averages may locate the resistance level of $25,000, which may allow for an extended recovery towards the potential resistance levels at $28,000, $30,000, and $32,000. However, an increase in selling pressure may cause the Bitcoin price to hit the supports at $15,000, $13,000, and $11,000.
BTC/USD Medium-Term Trend: Bearish (4H Chart)
Looking at the 4-hour chart, the Bitcoin price trades above the 9-day and 21-day moving averages. BTC/USD may cross above the channel’s upper boundary as the market is trying to recover from the bearish momentum. However, if the price breaks above the 9-day moving average and crosses above the upper boundary of the channel, higher resistance would be located at $23,000 but on the contrary, the technical indicator Relative Strength Index (14) is seen moving sideways.
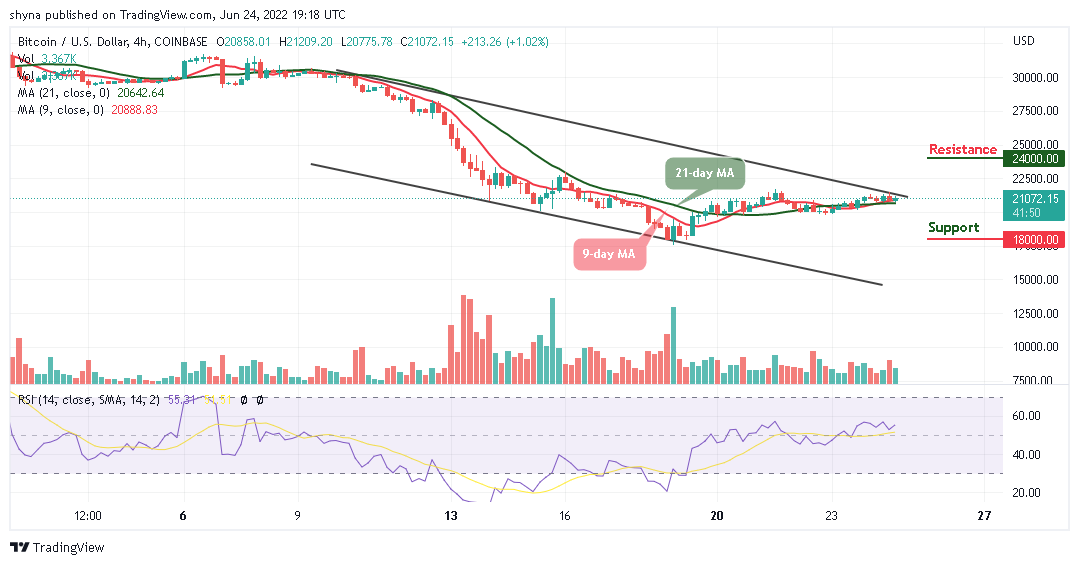
Moreover, if the bearish movement steps back, the support level of $20,000 may not be able to hold the selling pressure. Therefore, BTC/USD is likely to fall to $18,000 and below if the price moves toward the lower boundary of the channel.
Read more:
- How to buy Bitcoin
- How to buy Cryptocurrency
Join Our Telegram channel to stay up to date on breaking news coverage