Join Our Telegram channel to stay up to date on breaking news coverage
Bitcoin Price Prediction – July 28
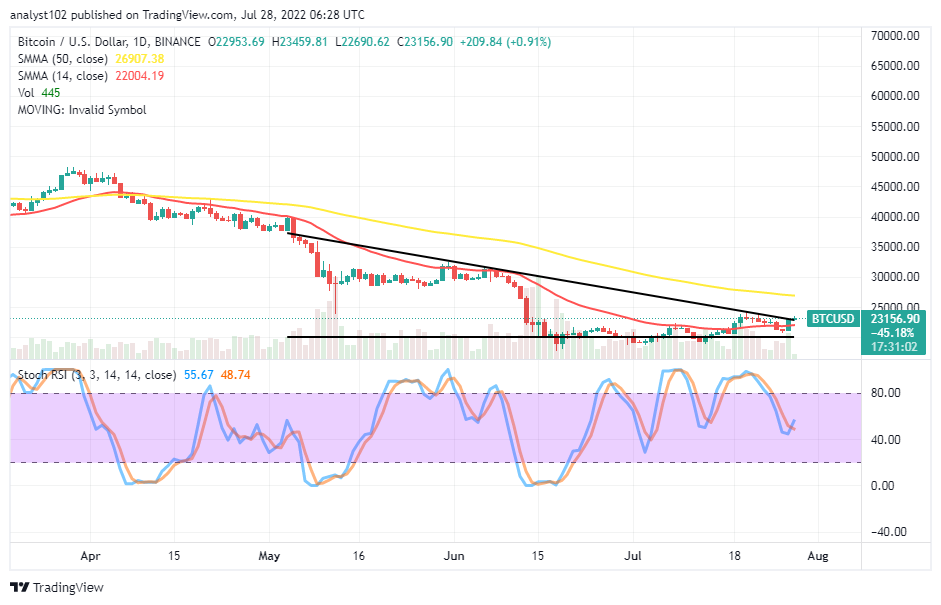
The market valuation of Bitcoin has seen beefing upwards against the trade stance of the US fiat currency. Yesterday’s operations witnessed a low of $21,070.81 and a high of $22,986.53. Price not trades around $23,156 at a minimal positive rate of 0.91%.
Bitcoin (BTC) Statistics:
BTC price now – $23,159.07
BTC market cap – $442.5 billion
BTC circulating supply – 19.1 million
BTC total supply – 19.1 million
Coinmarketcap ranking – #1
BTC/USD Market
Key Levels:
Resistance levels: $25,000, $27,500, $30,000
Support levels: $20,000, $17,500, $15,000
The BTC/USD daily chart shows the world’s number of cryptocurrencies is beefing upwards for recovery around the trend line of the smaller SMA. The 50-day SMA indicator’s positional stance is at $26,907.38 above the 14-day SMA indicator, which is at $22,004.19. A smaller bullish candlestick is in the making to denote the market is driving to push further hikes against the bearish trend line drawn closely over the smaller SMA. The Stochastic Oscillators are attempting to cross the lines northbound from a close range point above the 40. That is an indication that a buying force is in progress.
Can traders begin to buy into the BTC/USD market now?
There is no doubt that the BTC/USD market is currently undergoing a buying process as it has headlined that the crypto economy is beefing upwards through some imaginable resistances. Nevertheless, long-position traders need to be wary of any attempt to correct the moves at no time. The market’s value line at $22,500 will be instrumental in deciding a stable up if the price doesn’t breach against it in the near time.
On the downside of the technical analysis, the present outlook of the BTC/USD market portends price may face a risk of losing out to the upside until the price reaches a resistance around the trend line of the 50-day SMA. Thus, short-position traders may have to stay off the market for a while. In the case of price not pushing higher expectedly, a resumption of retracement to the downside will potentially be.
BTC/USD 4-hour Chart
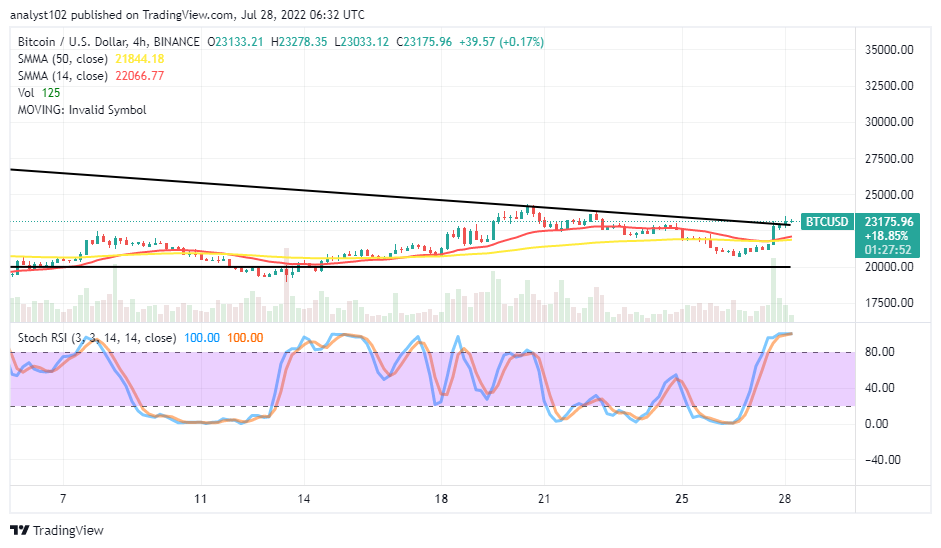
The BTC/USD medium-term shows that the crypto market is beefing upwards. And the situation has put the trade over the trend lines of the SMAs. The bearish trend line drew over the SMAs to mark the psychological points price may face in its motions to the north side. The 14-day SMA has curved down northward over the 50-day SMA. The Stochastic Oscillators are in the overbought region. And they have conjoined the lines to indicate prices may move in a consolidation manner for a while.
Read more:
Join Our Telegram channel to stay up to date on breaking news coverage


