Join Our Telegram channel to stay up to date on breaking news coverage
Bitcoin (BTC) Price Prediction – May 10
Over the past days, Bitcoin (BTC) tried to break above the $10,000 mark but with no success.
BTC/USD Long-term Trend: Bullish (Daily Chart)
Key levels:
Resistance Levels: $10,400, $10,600, $10,800
Support Levels: $7,200, $7,000, $6,800
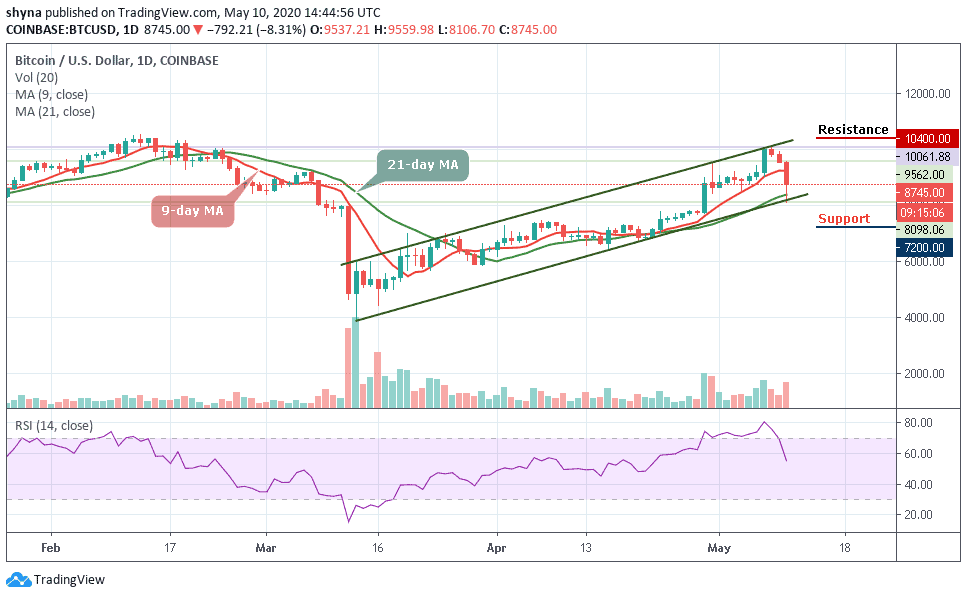
Today, BTC/USD pulls a shocking and devastating move against bullish investors following a tremendous fall from highs around $9,919 yesterday to touch the low of today at $8,098. At the time of writing, BTC/USD is trading 8.31% lower on the day and valued at $8,745. More so, the bulls failed to breach the $10,000 psychological level which happens to be one of the reasons why the coin is facing a downward trend.
Moreover, as the coin is trading at $8,745 displaying an intraday loss of 8.31%. The prevailing trend is still bullish with expanding volatility. Therefore, a break below the 21-day moving average may likely continue in the direction of the downtrend. In this case, BTC/USD could fall below $8,000 support and further movement may hit the critical supports at $7,200, $7,000, and $6,800.
However, if the bulls can hold the price to remain above the 9-day and 21-day moving averages and move up; the Bitcoin price could rise above the upper boundary of the channel and move to $10,400 vital resistance. A further high drive could send the coin to $10,600 and $10,800 resistance levels. Unfortunately, the technical indicator RSI (14) is revealing a sign of trend reversal, which shows a possible bearish momentum may likely play out.
BTC/USD Medium – Term Trend: Bullish (4H Chart)
Following the 4-hour chart, Bitcoin bears are now taking control and may likely push the coin below its previous support level that existed around $8,900. Although, the Bitcoin price has not yet slipped below $8,000 and it’s still in the loop of making a bounce back. Its price hovers around $8,687 and may take time to persistently trade above $9,500.
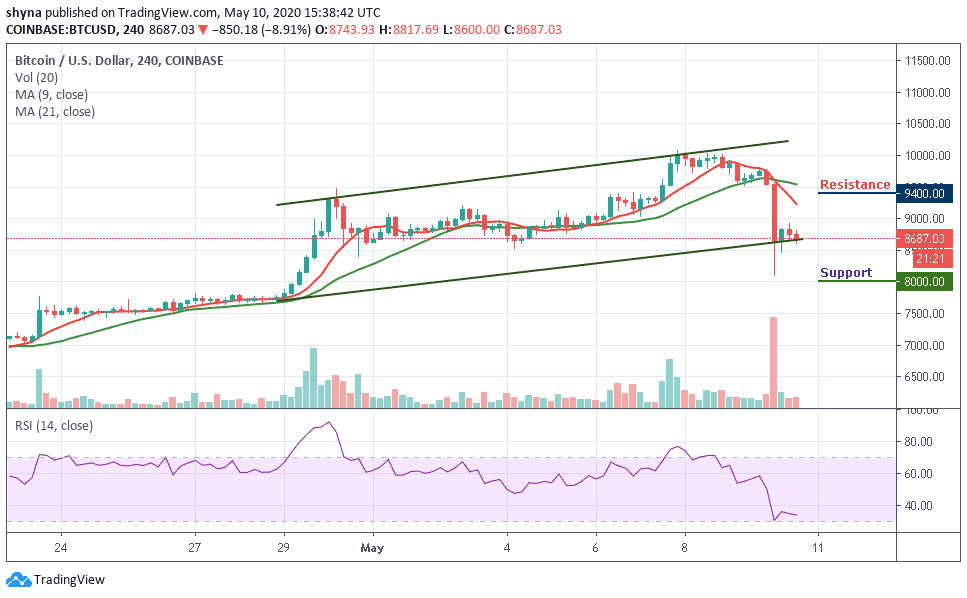
Moreover, BTC/USD is currently moving below the 9-day and 21-day moving averages and any upward movement could push the price near the $9,400, $9,600, and $9,800 resistance levels while the immediate support lies at $8,000, $7,800, and $7,600. The RSI (14) nosedives to 34-level, which may likely give more bearish signals before a reversal could play out.
Please note: Insidebitcoins.com is not a financial advisor. Do your research before investing your funds in any financial asset or presented product or event. We are not responsible for your investing results.
Join Our Telegram channel to stay up to date on breaking news coverage