Join Our Telegram channel to stay up to date on breaking news coverage
Bitcoin Price Prediction – January 20
The Bitcoin price prediction shows that BTC bulls’ comeback is likely to send the price towards the resistance level of $45,000.
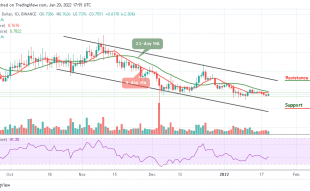
BTC/USD Long-term Trend: Bearish (Daily Chart)
Key levels:
Resistance Levels: $47,500, $49,500, $51,000
Support Levels: $37,500, $35,500, $33,500

The daily chart is showing that BTC/USD may be back to trade above $45,000 following a bearish correction. Today, the Asian session is characterized by a renewed upward trend whereby BTC/USD tries to cross above the upper boundary of the channel. Moreover, Bitcoin price is currently hovering 2.64% higher on the day at $42,775 around the 9-day moving average.
Bitcoin Price Prediction: Bitcoin (BTC) May Move Above $45,000
At the time of writing, the Bitcoin price is trading around the upper boundary of the channel. On a bullish note, looking at the technical indicator, the Relative Strength Index (14), the signal line is moving above 40-level which suggests that the Bitcoin price could once again move to the upside, which is above the channel.
Moreover, according to the daily chart, the strong bullish movement above the channel may take the price to the resistance levels of $47,500, $49,500, and $51,500. In addition, if the market makes a quick turn to the south, BTC/USD may likely drop to $40,000, and should this support fail to contain the sell-off, traders may see a further roll back to $37,500, $35,500, and critically $33,500.
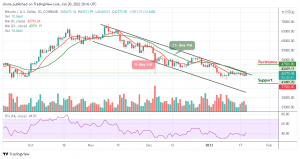
BTC/USD Medium – Term Trend: Ranging (4H Chart)
Following the 4-hour chart, Bitcoin (BTC) bears have now stepped back into the market bringing the price above $46,000. Although the Bitcoin price has not yet closed above $42,500. However, the Bitcoin price is hovering around $42,629 and may take time to persistently trade above $43,000.
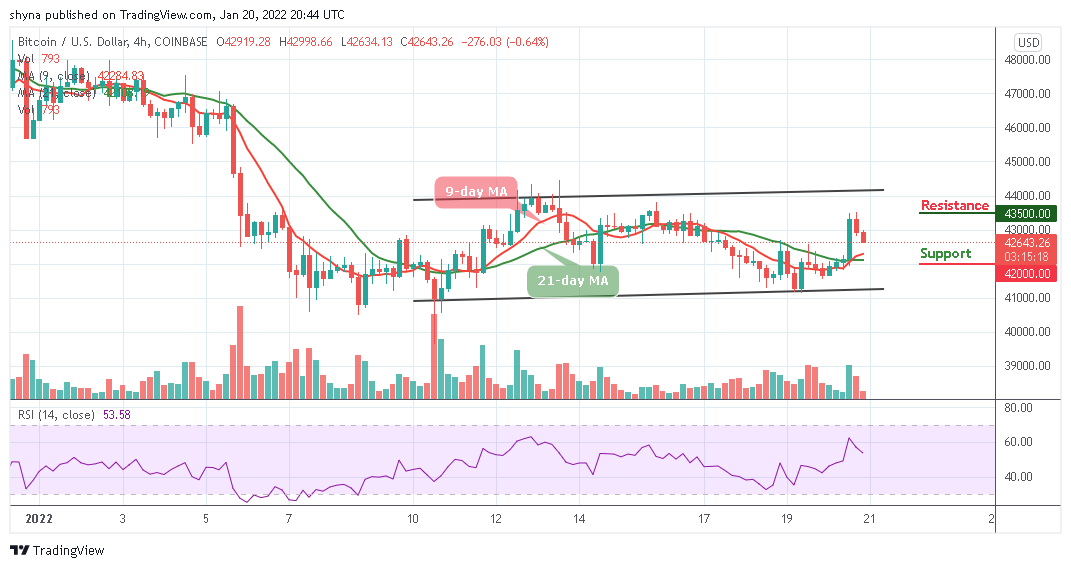
Now, BTC/USD continues to move above the 9-day and 21-day moving averages. More so, as the technical indicator Relative Strength Index (14) moves below 60-level, the downward movement may likely bring the price to the nearest support level of $42,000 and below while the immediate resistance lies at $43,500 and above.
Looking to buy or trade Bitcoin (BTC) now? Invest at eToro!
68% of retail investor accounts lose money when trading CFDs with this provider
Read more:
- How to buy Bitcoin
- How to buy Cryptocurrency
Join Our Telegram channel to stay up to date on breaking news coverage