Join Our Telegram channel to stay up to date on breaking news coverage
Ripple Price Prediction – January 20
The Ripple price prediction is slightly bullish as the market gets ready to respect the $0.70 support and could push the coin upward.
XRP/USD Market
Key Levels:
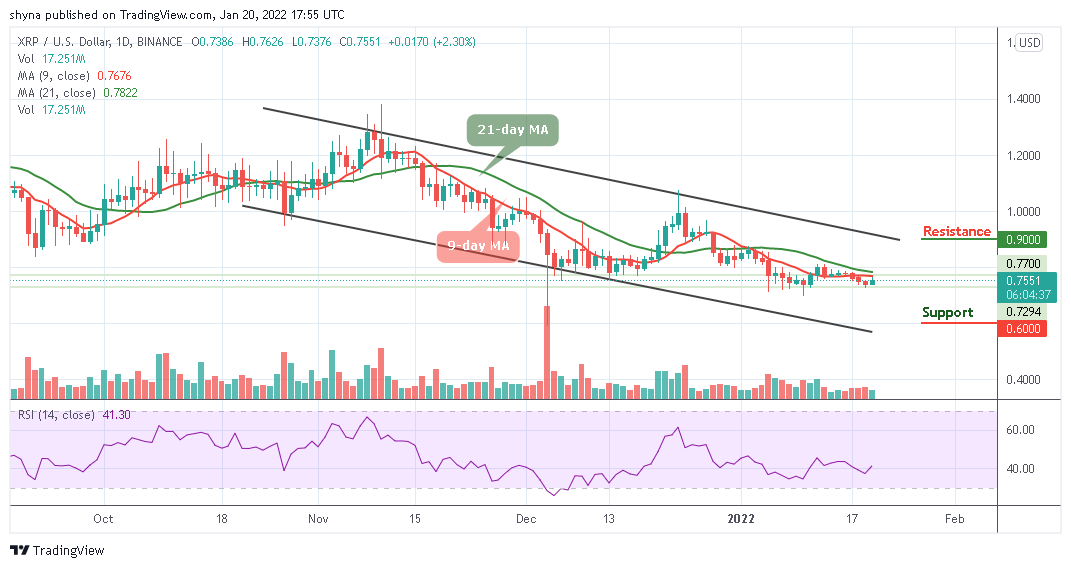
Resistance levels: $0.90, $0.95, $1.00
Support levels: $0.60, $0.55, $0.50
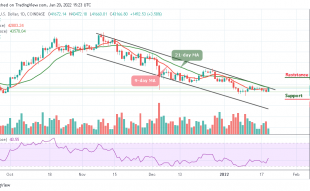
XRP/USD has been moving sideways since a few weeks ago but gaining by 2.300% during the negotiation today. Looking at the daily chart, the Ripple (XRP) is now trying to cross above the 9-day and 21-day moving averages after touching the daily low at $0.73. At the time of writing, bulls are trying to come back into the market with a push to the upside, which may head towards the resistance level of $0.80
Ripple Price Prediction: Ripple Price May Struggle Above $0.80
The Ripple price is likely to head towards the 9-day moving average as the coin begins a slight increase since the opening of today’s trading at $0.73. In the meantime, the Ripple (XRP) may continue to range before deciding on the next direction.
Moreover, should in case the price breaks above the 9-day and 21-day moving averages, the resistance levels of $0.90, $0.95, and $1.00 could be reached. Meanwhile, for a break towards the lower boundary of the channel, the Ripple price may hit the supports at $0.60 and $0.55 and if the price falls below the previous levels, another support could be located at $0.50 while the Relative Strength Index (14) begins a journey to cross above 40-level.
When compares with Bitcoin, the Ripple price is currently changing hands at 1765 SAT and it’s hovering below the 9-day and 21-day moving averages. However, if the coin crosses above the moving averages, the Ripple price may likely face additional resistance towards the upper boundary of the and it may hit the resistance level of 1900 SAT and above.
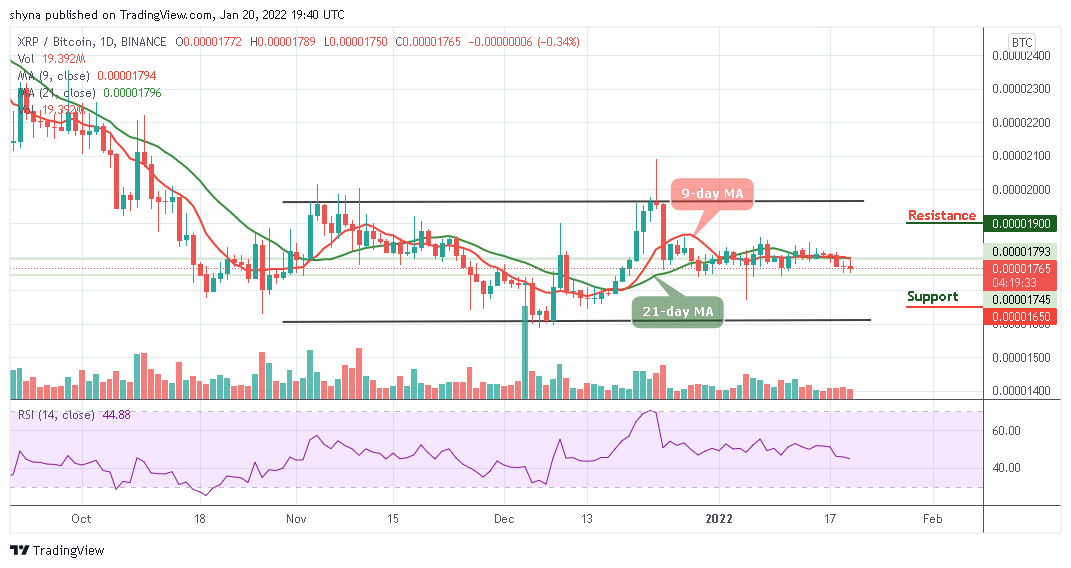
In the meantime, if the bears keep the price below the moving averages, the market may begin a downtrend and it could probably record further declines towards the lower boundary of the channel. However, a further bearish move could bring the coin to the support level of 1650 SAT and below while the signal line of the Relative Strength Index (14) moves to cross below 40-level.
Looking to buy or trade Ripple (XRP) now? Invest at eToro!
68% of retail investor accounts lose money when trading CFDs with this provider
Join Our Telegram channel to stay up to date on breaking news coverage