Join Our Telegram channel to stay up to date on breaking news coverage
Bitcoin (BTC) Price Prediction – March 28
BTC/USD sell-off below 9-day moving average worsened the short-term technical picture.
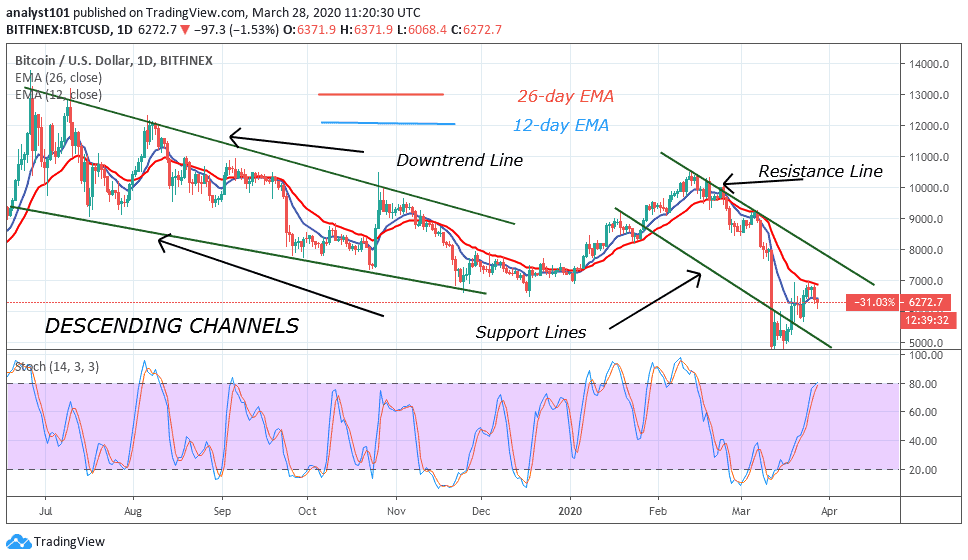
BTC/USD Long-term Trend: Bullish (Daily Chart)
Key levels:
Resistance Levels: $7,600, $7,800, $8,000
Support Levels: $5,000, $4,800, $4,600
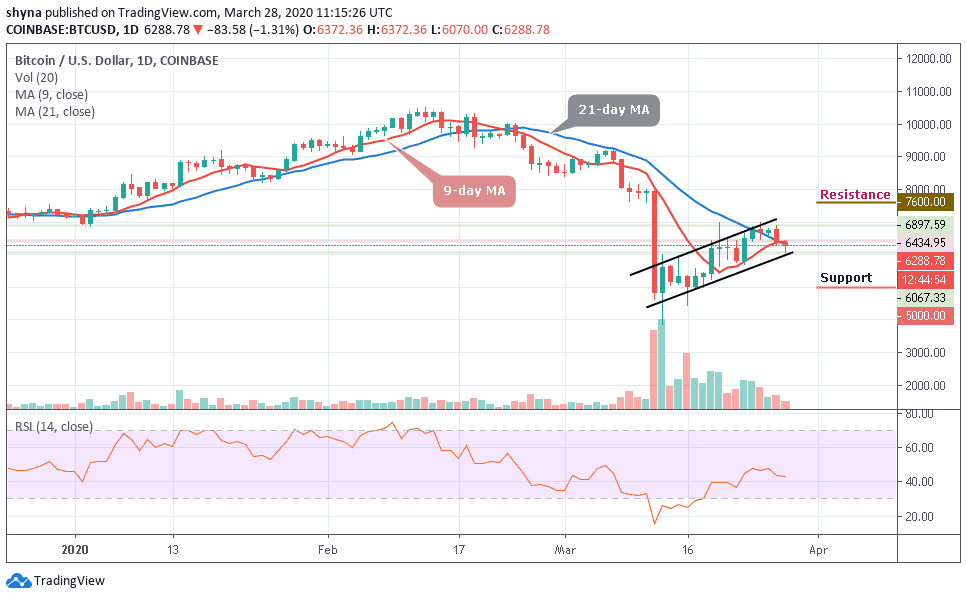
BTC/USD extended the downside move during the early Asian hours of today. The Bitcoin price tested the intraday low at $6,067 and recovered to $6,288 by press time; however, the coin is still 1.31% lower at the time of writing. Currently, the RSI (14) is seen moving around 43-level as the BTC/USD moves below the 9-day and 21-day moving averages within a short-term bullish trend amid low volatility.
Nevertheless, BTC/USD crashed below the 9-day MA at $6,400 and continued the sell-off as the move below important support area attracted new speculative sellers to the market. However, despite the sharp decrease, the Bitcoin price remains bullish as long as it stays above $6,000. If this barrier is taken out, the bearish momentum may gain traction and we could see a sharp sell-off towards the next important target of $5,000, $4,800 and $4,600 support levels.
On the upside, traders will need to see a sustainable move above $6,500 for the upside to gain traction. This former support is reinforced by the moving averages and once it is out of the way, the upside is likely to gain traction with the next focus on $6,800 and $7,000 area that limited the recovery for the most part of the week. Any further bullish movement could send the price to the potential resistance of $7,600, $7,800 and $8,000.
BTC/USD Medium-Term Trend: Ranging (4H Chart)
On the 4-hour chart, BTC/USD makes a series of higher highs and lows as the coin moves below the 9-day and 21-day moving averages. BTC price hovers around $6,228 and may take time to persistently trade above $6,500. The upward movement is facing hurdles near the $6,600 and $6,800 resistance level.
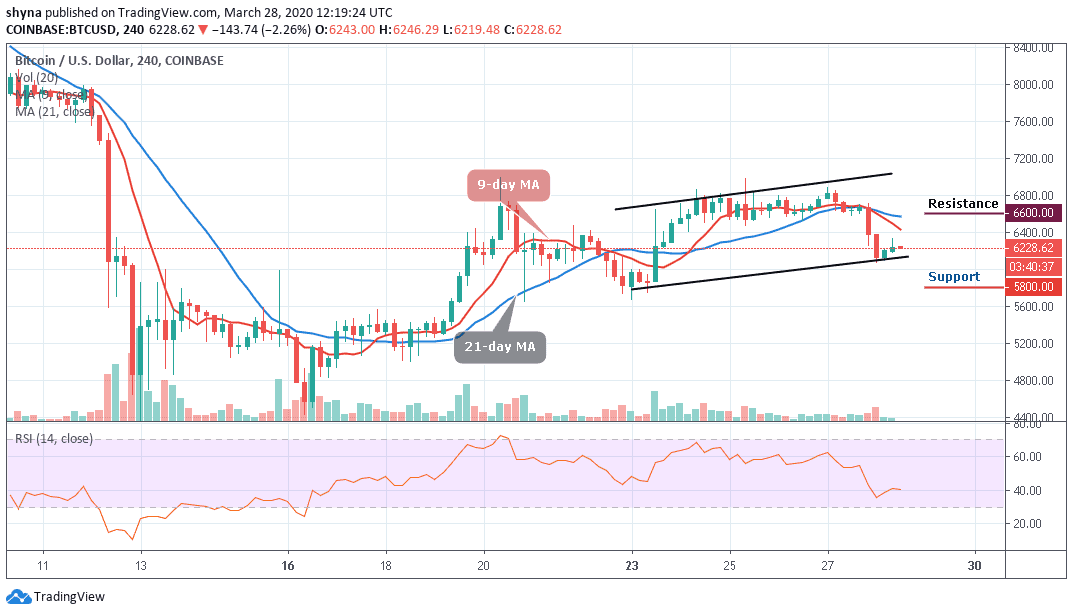
Furthermore, on the downside, immediate support is near the $6,000 level while the main support is at the $5,900 level. The price might slide sharply below $5,800 which may likely test the critical support at $5,600 level. Technically, Bitcoin is currently moving in sideways while the RSI (14) hovers around 40-level.
Please note: Insidebitcoins.com is not a financial advisor. Do your research before investing your funds in any financial asset or presented product or event. We are not responsible for your investing results.
Join Our Telegram channel to stay up to date on breaking news coverage