Join Our Telegram channel to stay up to date on breaking news coverage
Bitcoin Price Prediction – February 7
There has been a note as BTC/USD price witnesses relative long-moves from a low value around $30,000 upward to now trade at a high point around $40,000 like it did on January 7.
BTC/USD Market
Key Levels:
Resistance levels: $44,000, $48,000, $52,000,
Support levels: $30,000, $26,000, $22,000
BTC/USD – Daily Chart
As of now, the daily trading chart depicts that a support level has built-up around $30,000 over trading days’ sessions. Taking a close look at the 14-day SMA trend-line, it has observed that it has seemingly bent northward over the 50-day SMA’s. And, it is underneath the current market trading point. The bigger-SMA indicator points strongly to the north direction. That signifies that the straight path to the moon as regards BTC/USD is much more intact. The stochastic Oscillators have again freshly dipped into the overbought region. That shows that the price movements may be featuring in a consolidating manner for upward sustainability.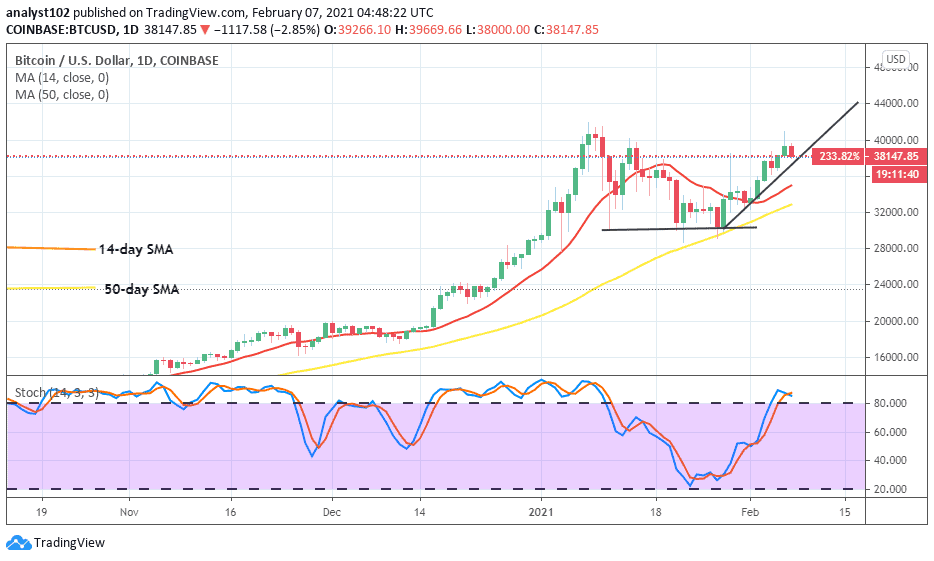
What could be the next price formation of BTC/USD trade?
It is still somewhat that BTC/USD market-bulls are mostly relaxing efforts in pushing the crypto’s value far away from the last range-trading zone of $40,000. Instead, they have only built-up from a support level located around $30,000 to trade around a high point mentioned earlier. The BTC/USD bulls need a forceful breakout of the resistance $40,000 line to affirm a decent continuation of an upswing price move.
On the downside, it would technically augur well for BTC/USD bears to find an entry during a notable price reversal moves between the levels of $44,000 and $40,00, especially during a volatile market-move. In the wake of that assumption, a healthy upward reversal will most likely lead the market to price lowly around the $32,000 mark afterward. 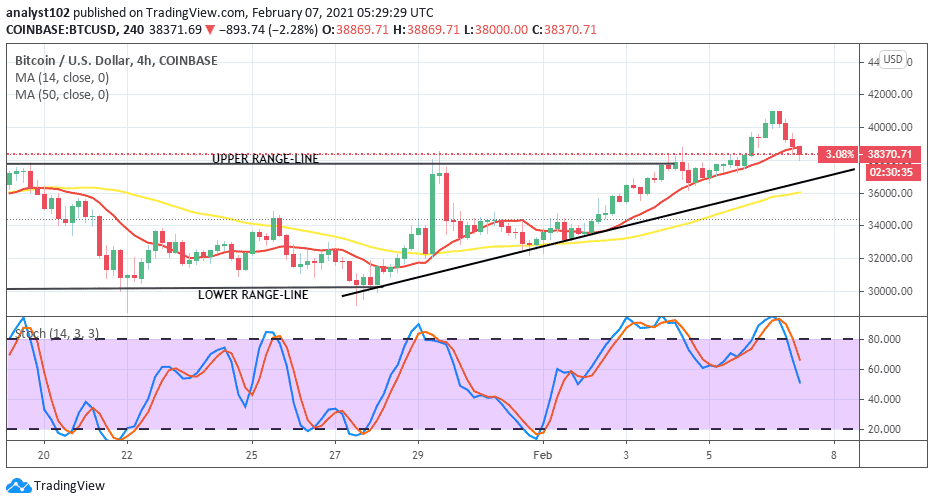
BTC/USD 4-hour Chart
The 4hour-chart, pictures a slight increase in the valuation of BTC/USD market operations as the upper range-line has breached past to the north.. However, the crypto is currently facing a correctional-move. Price has retraced briefly against the 14-day SMA trading indicator. The 50-day SMA trend-line is yet pointing towards the north-direction. That suggests that buying pressures are still in focus. The Stochastic Oscillators are pointing southbound to signal that the downward correctional move has not been exhausted. Hence, a need to exercise cautiousness before reconsidering joining a bullish run of the crypto-market. That said, a decent support level for bulls appears to be at around the $36,000 line if not violently broken to the south in the next trading sessions.
Join Our Telegram channel to stay up to date on breaking news coverage