Join Our Telegram channel to stay up to date on breaking news coverage
Bitcoin (BTC) Price Prediction – September 25
Bitcoin (BTC) price drops below $9,000 for the first time since June 2019. Right now, the coin is trying to fall again, but the essential support is becoming a threat to the bears.
BTC/USD Long-term Trend: Bearish (Daily Chart)
Key levels:
Resistance Levels: $10,500, $11,000, $11,500
Support Levels: $7,000, $6,500, $6,000
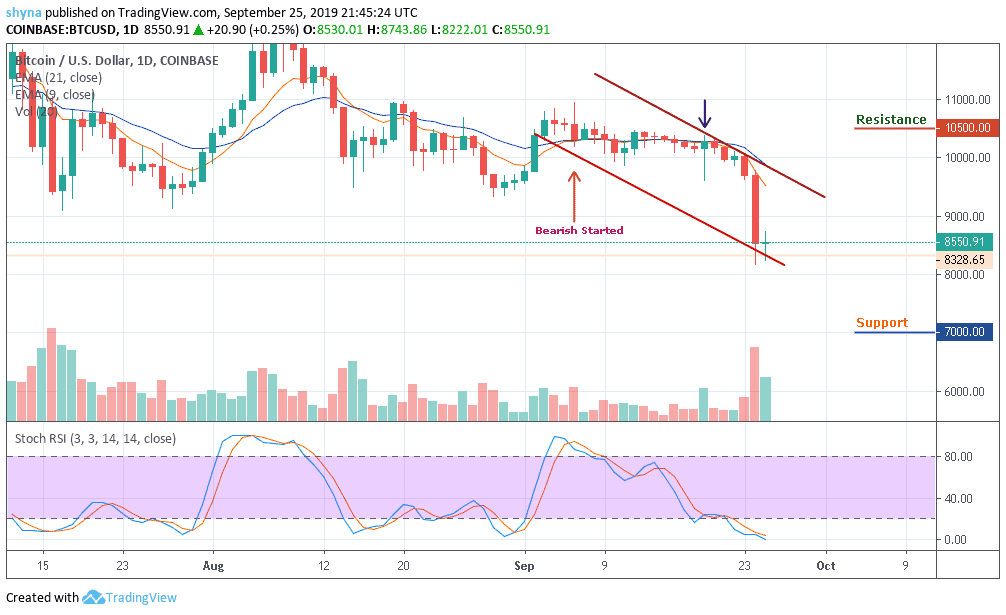
Since September 6, BTC/USD has continued to send panic into the market as the trend remains bearish and essential support of $10,000, which has progressed well in recent days, posed a problem. The September 19 break under the mentioned support could not rebound near the $10,400. Right now, Bitcoin is trying to fall again, but essential support is becoming a threat to the bears. However, the last price drop resulted in a -1.67% decline in BTC/USD over the last 24 hours of trading.
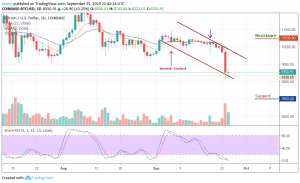
Currently, Bitcoin price is moving inside a descending channel pattern and below the moving averages of 9-day and 21-day on the daily chart. After falling to $9,600 support on September 19, 2019, BTC saw a quick price jump to the upper boundary of the channel, from where the bear resume pressure. Now, the price is facing the $8,500 important support. Once this support breaks, the $7,000, $6,500 and $6,000 support may come into play.
Meanwhile, in the opposite direction, if the critical support can continue to provide support for the market, we can expect the price to climb back to $10,500 and $11,080 resistance before we can see a rise far above the channel formation to meet $11,500 and above. But as it stands now, BTC/USD is on a downward range. The stochastic RSI has dropped into the oversold condition. A further drop may cause the Bitcoin price to fall seriously.
BTC/USD Medium-term Trend: Ranging (4H Chart)
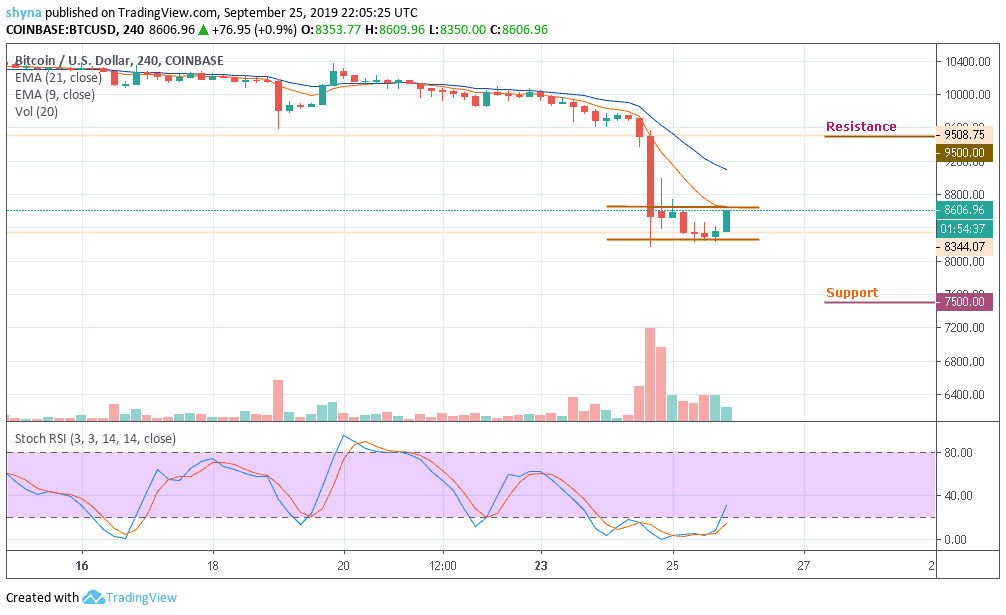
Looking at the 4-hour chart, BTC/USD had a heavily bearish moment and the price dropped from $9,508 to 8,344 going below $9,000 for the first time since June 2019. The price has since recovered and now trading at $8,606. The hourly breakdown shows that the price moves in sideways and may soon experience a breakout out to face the resistance level at $9,500 and above. More so, the Stochastic RSI recovers from the oversold, indicating more bullish signals in the market.
Please note: Insidebitcoins.com is not a financial advisor. Do your research before investing your funds in any financial asset or presented product or event. We are not responsible for your investing results.
Join Our Telegram channel to stay up to date on breaking news coverage