

Join Our Telegram channel to stay up to date on breaking news coverage
Bitcoin (BTC) Price Prediction – May 15
The price of Bitcoin may retest $7,500 if the bears regain control of the market.
BTC/USD Long-term Trend: Bullish (Daily Chart)
Key levels:
Resistance Levels: $10,800, $11,000, $11,200
Support Levels: $8,200, $8,000, $7,800
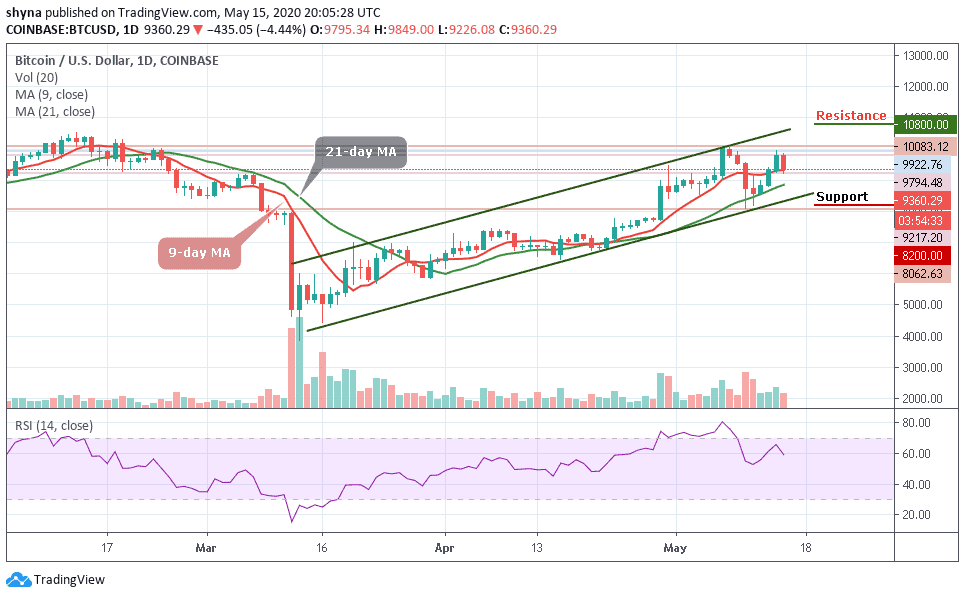
After touching the intraday low of $9,217 level, BTC/USD is recovering to trade at $9,360 at the time of writing. Despite the recovery, the first digital asset has lost over 4.44% since the start of the day amid strong bearish sentiments that replaced the optimism after a failed attempt to break above $10,000 yesterday.
However, from a technical perspective, we can easily see that BTC/USD is currently having a bearish bias. The technical indicator RSI (14), for instance, is pointing to the south after retreating from the overbought condition in the first week of this month. Therefore, if the support at 60 fails to hold, and the indicator slumps to 50 which is the average, the losses could gain momentum towards $9,000. If the sell-off materializes, BTC/USD may retest $7,500.
Moreover, if the market continues with the downward trend, the Bitcoin price could drop to the nearest support at $8,800, and should this support fails to contain the sell-off; traders may see a further roll back to $8,200, $8,000 and critically $7,800. Meanwhile, any bullish cross above the channel may reach the resistance at $10,800, $11,000, and $11,200 levels.
BTC/USD Medium-Term Trend: Bullish (4H Chart)
Looking at the 4-Hour chart, Bitcoin (BTC) is yet to cross below $9,000 and it may be in the loop of making a bounce back. BTC/USD price hovers below the 9-day MA but still above the 21-day MA. At the moment, the Bitcoin price is currently moving around $7,350 level. However, if buyers could regroup and push the price back above $9,500, we can expect a retest of $9,800 resistance level.
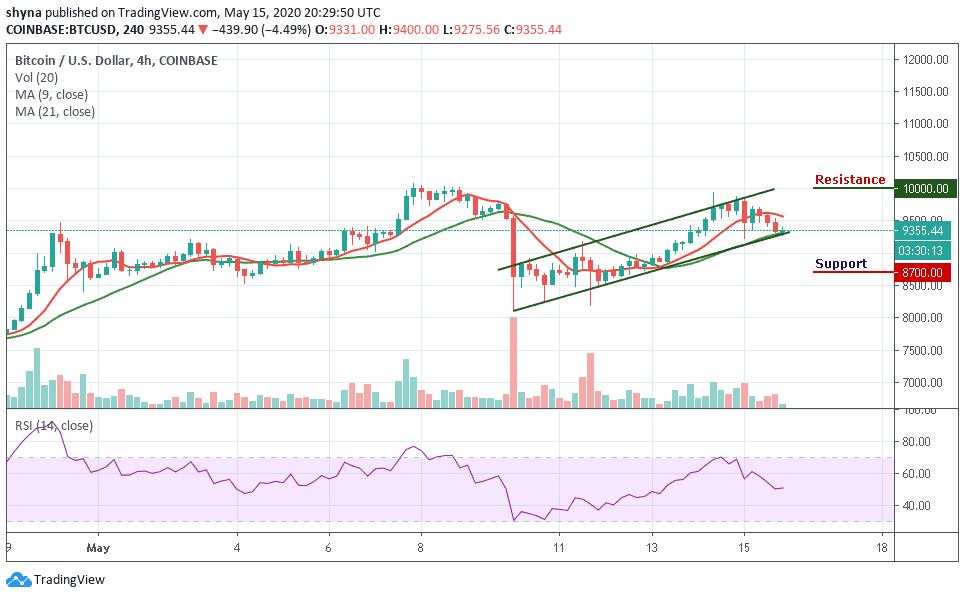
Therefore, breaking the mentioned resistance could also allow the bulls to retest the $10,000 level before other resistance levels at $10,200 and $10,400. Nevertheless, if the bears could hold the price and continue to push it downward, then the support level of $8,700, $8,500, and $8,300 may be visited as the RSI (14) is moving around the average, trading at 51-level.
Please note: Insidebitcoins.com is not a financial advisor. Do your research before investing your funds in any financial asset or presented product or event. We are not responsible for your investing results.
Join Our Telegram channel to stay up to date on breaking news coverage
