Join Our Telegram channel to stay up to date on breaking news coverage
Bitcoin Price Prediction – December 31
The Bitcoin price prediction rises for another bullish day as the technical indicator continues to move above 40-level.
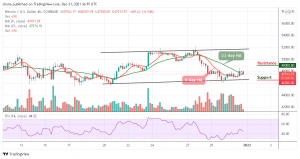
BTC/USD Long-term Trend: Bearish (Weekly Chart)
Key levels:
Resistance Levels: $52,000, $54,000, $56,000
Support Levels: $44,000, $42,000, $40,000
BTC/USD is seen pushing the market price towards the 9-day and 21-day moving averages as the coin touches the daily high of $48,574 at the time of writing. The first digital asset is currently moving with a bullish momentum after a sustainable break above an important technical level.
Bitcoin Price Prediction: Bitcoin (BTC) May Break Higher
As the Bitcoin price continues to move towards the resistance level of $49,000, the first digital asset is likely to revisit the $50k again. However, the daily chart reveals that the technical indicator Relative Strength Index (14) is floating above 40-level, therefore, the bulls are likely to push the king coin to upside. Additionally, the price is yet to cross above the 9-day and 21-day moving averages, suggesting that BTC/USD could retreat towards $46,000, before attempting to break higher.
Moreover, the 9-day and 21-day moving averages may begin to edge higher, showing no significant bearish pressure for the time being. On the upside, a daily close above the upper boundary of the channel could lift the price to resistance levels of $52,000, $54,000, and $56,000. On the contrary, BTC/USD could retreat towards the lower boundary of the channel. Breaking below $45,000 could locate the critical supports at $44,000, $42,000, and $40,000 respectively.
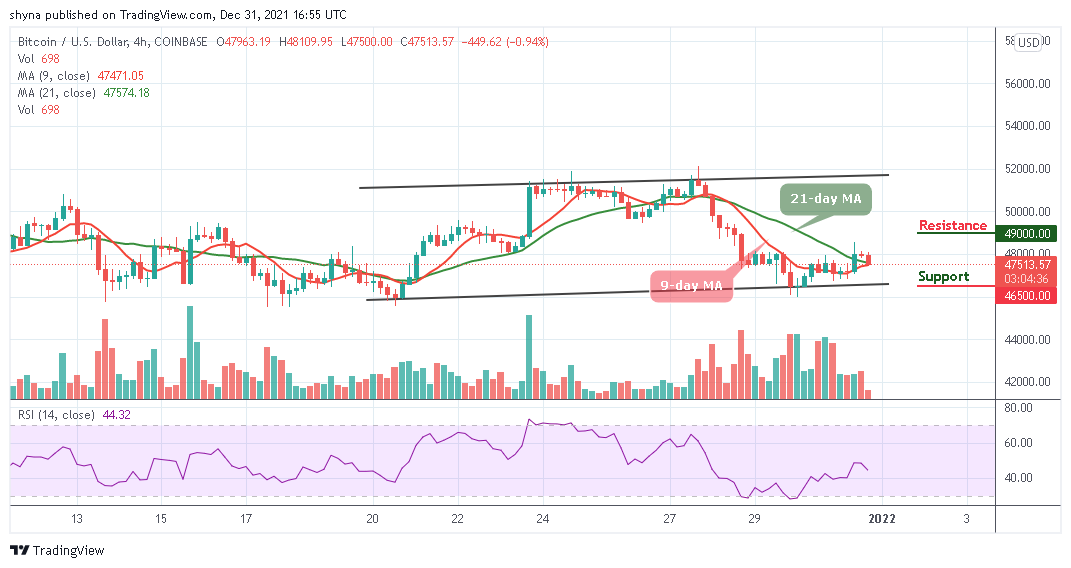
BTC/USD Medium – Term Trend: Ranging (4H Chart)
According to the 4-hour chart, BTC/USD is currently in the ascending range of the medium-term outlook as the target market is keeping the support levels of $46,500, $44,500, and $42,500. Meanwhile, the bulls are gaining momentum with the support of a 9-day and 21-day moving averages as the buyers keep the position intact.

Looking at the technical indicator Relative Strength Index (14), it shows that BTC price may begin to move downwards before a rebound could take place. Immediately after the market rebounds, the buyers may hit the resistance levels of $49,000, $51,000, and $53,000 respectively.
Looking to buy or trade Bitcoin (BTC) now? Invest at eToro!
68% of retail investor accounts lose money when trading CFDs with this provider
Read more:
- How to buy Bitcoin
- How to buy Cryptocurrency
Join Our Telegram channel to stay up to date on breaking news coverage