Join Our Telegram channel to stay up to date on breaking news coverage
Bitcoin Price Prediction – April 25
At last, the BTC/USD market worth has dropped in a correctional move to reach the low trading value of $50,000.
BTC/USD Market
Key Levels:
Resistance levels: $55,000, $60,000, $65,000,
Support levels: $45,000, $40,000, $35,000
BTC/USD – Daily Chart
On April 23, the BTC/USD trading chart featured a long bearish bottom shadow candlestick that emerged between the main support level of $50,000 and, from it of about a half-point to the lower support of $45,000 level. The subsequent candles featuring a light-rallying move around the main support mentioned at the start. The 14-day SMA trend-line is a bit bent to the south near above the $55,000 resistance level as the 50-day SMA indicator is firmly situated at the $50,000 main support trading level. The Stochastic Oscillators have conjoined hairs in the oversold region with a less-active move to indicate an indecision trading stance of the market operations between BTC and the US Dollar currently. 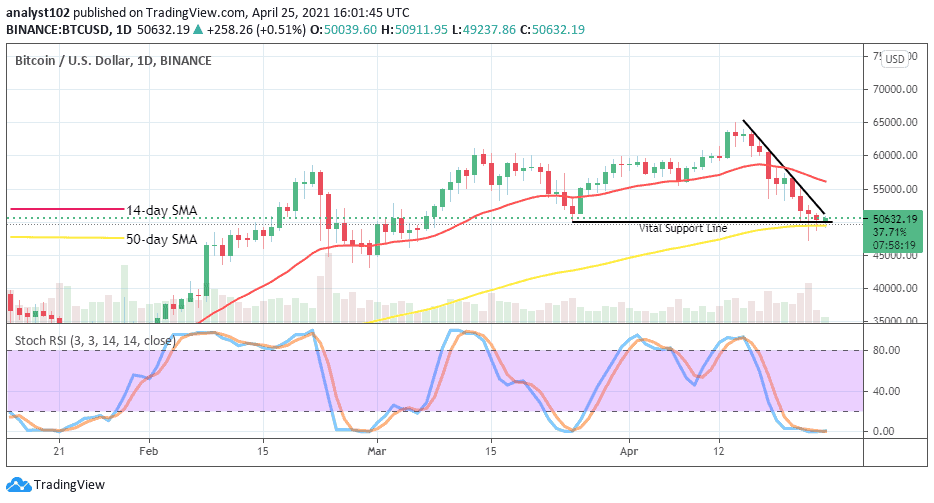
Will the BTC/USD market breakdown past the $50,000 support level?
Further breaking past the $50,000 support level may be difficult for the BTC/USD price in the near trading session. In the few hours of trading around that point, the crypto-market has witnessed some slight degrees of unsustainable short moves. And, that can allow the creation of an event to attract bulls to take back the market’s advantage in no time.
Having had a set of serial pushes down to the vital support line of $50,000 level, bears may tend to get relaxed to allow some moves a bit upward from the point before probably aiming for a re-launch around the resistance line of $55,000. However, that may not be forthcoming in the near session. As a result, the present trading outlook has a high tendency of degenerating into a range-bound moving market.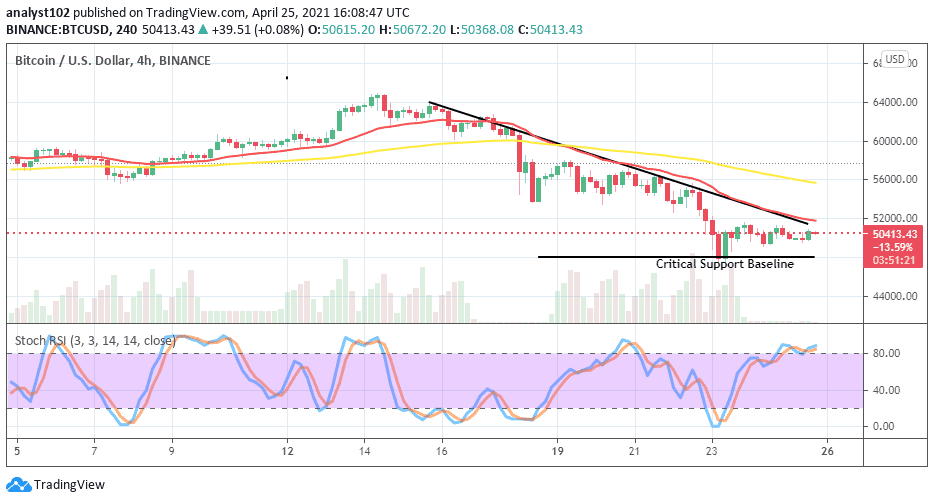
BTC/USD 4-hour Chart
There has been a kind of decline pressures in the medium-term market valuation of BTC/USD for over a week and some days now. However, the market levels of $52,000 and $48,000 have been witnessing a line of fluctuations from April 23 until the present. The 14-day SMA trend-line is underneath the 50-day SMA indicator. And, they are all over the current trading zone of the market. The Stochastic Oscillators have struggled to make a move briefly into the overbought region. They seem to resume a consolidation move around the region which may potentially lead to paving a way for the full-fledge of bulls[ return in the crypto-economy afterward.
Join Our Telegram channel to stay up to date on breaking news coverage