

Join Our Telegram channel to stay up to date on breaking news coverage
Ethereum Price Prediction – April 25
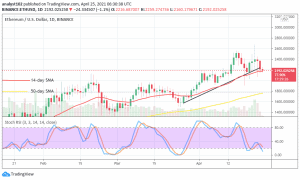
On April 22, the market trading line of ETH/USD saw a fake short break-out of the $2,600 resistance. And, in the wake of that scenario, price now pulls back to trade at a low point of $2,200.
ETH/USD Market
Key Levels:
Resistance levels: $2,400, $2,600, $2,800
Support levels: $1,900, $1,700, $1,500
ETH/USD – Daily Chart
It appears now on the ETH/USD daily trading chart that the crypto-market is experiencing a small-sized trade formation that suggests the presence of a range-bound situation. The 14-day SMA trading trend-line maintains a straight posture as the bullish trend-line is also drawn along in support of it to locate a critical trading support line against the present upward trend correction in the market. The 50-day SMA indicator is a bit under the level of $1,800 far apart from the smaller trading indicator. The Stochastic Oscillators are now of a bit pointing to the south around range 20. That indicates that some degree of price depreciating is on course.
Will the ETH/USD 2,200 level be the last uptrend correctional line?
Some indications suggest that the ETH/USD market-level may not be breached further to the south to give a clear suggestion of price correctional extension. That said, there some failing attempts that have featured in the market to lower further below the $2,200 level but they have been retarded against by bulls in the market. In that similar trading format, bulls may continually for a while allow small southward pushes before attempting to revert the moves afterward.
The ETH/USD bulls’ strength as currently indicated seems not enough to plunge down the market line sustainably below the level of $2,200. Nevertheless, if they garner more energy to hold price around the level mentioned earlier, the crypto-market will probably witness a line of series bearish moves down to support trading areas around the $1,800 mark in the long run.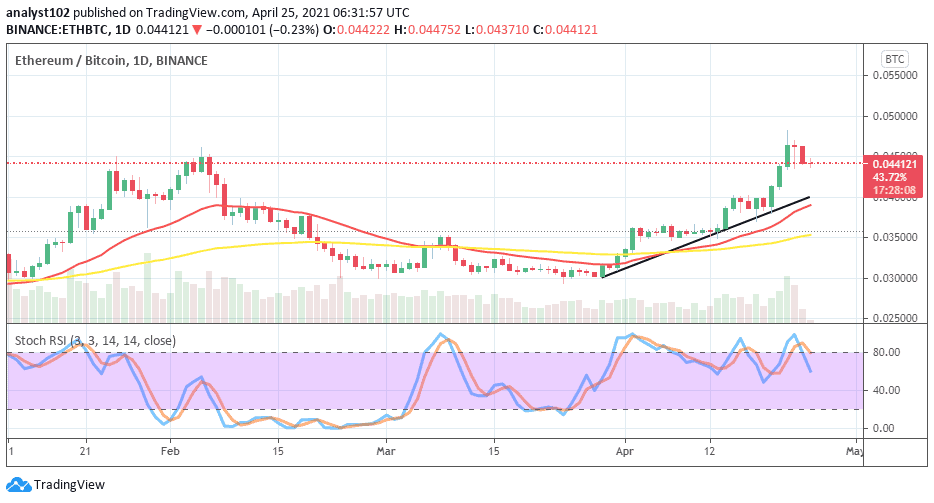
ETH/BTC Price Analysis
Comparing the market purchasing capacity between ETH and BTC, it is still that the base trading instrument prevails over the weaknesses of the counter trading tool quite a while in the crypto’s market space. Until the present time of writing, the bullish and the 14-day SMA trendlines are closely located along the path-way to the north below the high point of the trading zone of the two cryptos as paired. The 50-day SMA indicator is underneath them. The Stochastic Oscillators have slightly crossed range 80 to the south getting a reach around range 60. That suggests that the counter crypto is somehow getting prepared to launch a come-back in a near session.
Join Our Telegram channel to stay up to date on breaking news coverage
