Join Our Telegram channel to stay up to date on breaking news coverage
Bitcoin (BTC) Price Prediction – August 5
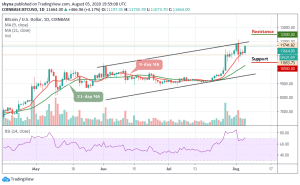
Bitcoin (BTC) continues to rise, briefly surpassing the $11,600 mark amid bullish market conditions.
BTC/USD Long-term Trend: Bullish (Daily Chart)
Key levels:
Resistance Levels: $12,500, $12,700, $12,900
Support Levels: $10,500, $10,300, $10,100
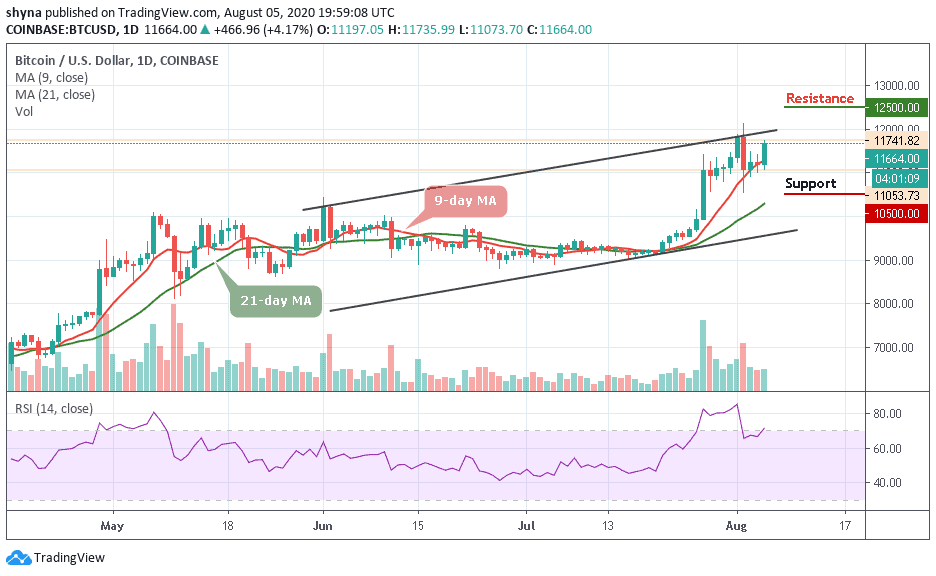
According to the daily chart, BTC/USD has been on an upward trend since July 21, while it has met various resistance levels when trying to test the $12,000 mark at the start of August but there are some important technical barriers below and above the current price. This simply means that the Bitcoin (BTC) may likely spend some time consolidating gains at the current levels; however, in the long-run, the trend stays bullish as long as the price is above $11,000 while the RSI (14) resumes back into the overbought region.
Next Possible Direction for BTC/USD
On the daily chart, BTC/USD jumps marginally above the 9-day moving average at $11,420, currently trading at $11,664 with 4.19% gains. Therefore, if the move is sustained, the recovery may be extended towards the $11,800 level. Once this is out of the way, the very important resistance at $12,000 may come into play.
More so, the Bitcoin price touches the daily high at $11,741 today; this barrier may likely slow down the bulls as the coin may consolidate a little-bit before reaching the potential resistance at $12,500, $12,700 and $12,900 levels.
On the downside, if the market price breaks below the 9-day moving average, the local supports may come at $11,200 and $11,000 respectively. Ant further bearish movement may likely hit the critical supports at $10,500, $10,300, and $10,100 respectively.
BTC/USD Medium-Term Trend: Ranging (4H Chart)
On the 4-hour chart, BTC/USD is seen following a sideways movement since July 27, the coin is currently trading above the 9-day and 21-day moving averages. The Bitcoin price may follow the upward movement if the technical indicator RSI (14) remains above the 60-level.
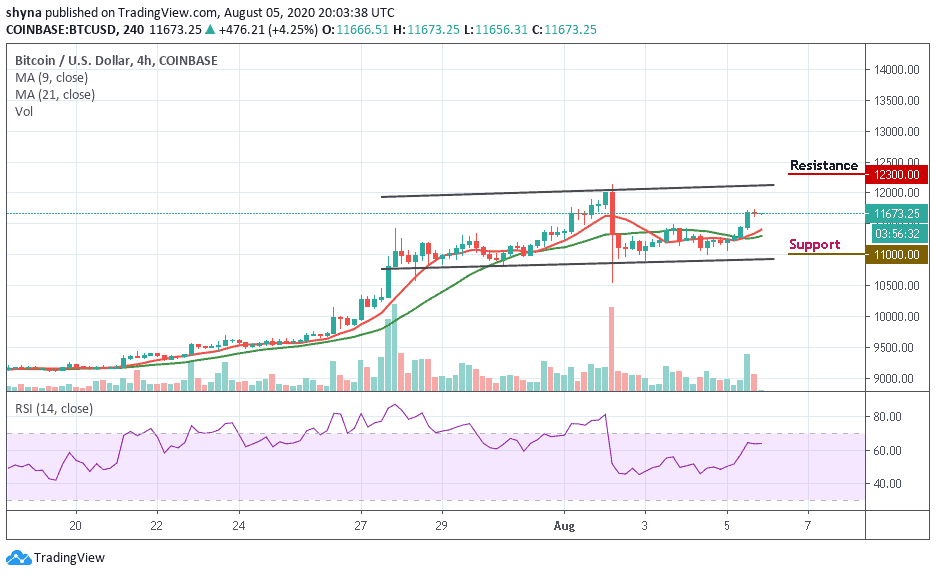
The potential resistance is located at $12,300 and above while the supports may be found under the moving averages at $11,000 and below.
Join Our Telegram channel to stay up to date on breaking news coverage