Join Our Telegram channel to stay up to date on breaking news coverage
BCH Resorts to Ranging – June 26
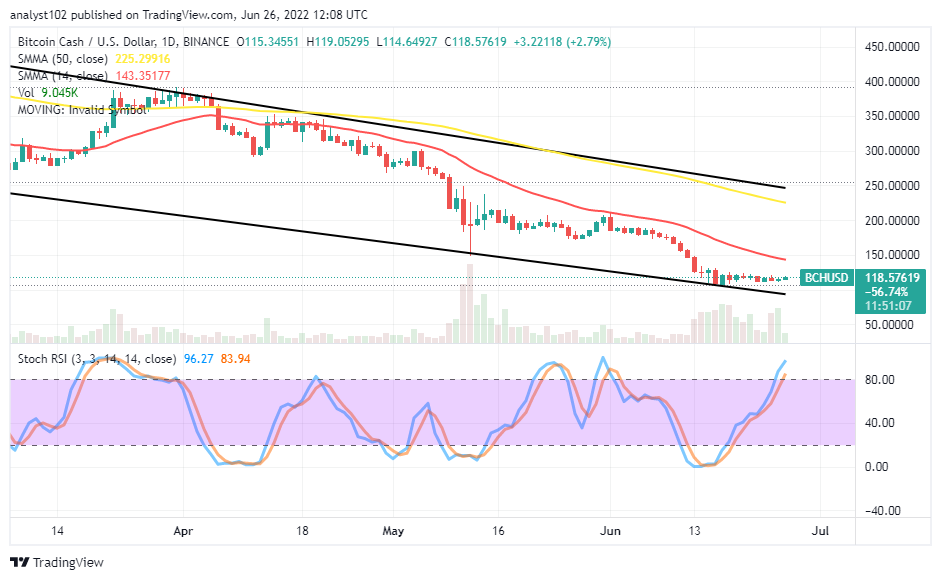
After a line of significant falling forces in the BCH/USD market operations, the crypto’s price currently resorts to ranging motions at a lower trading end. The upward and the downward moves are between $119 and $114 at a positive percentage rate of 2.79.
BCH Price Statistics:
BCH price now – $116.11
BCH market cap – $2.2 billion
BCH circulating supply – 19.1 million
BCH total supply – 19.1 million
Coinmarketcap ranking – #30
BCH Resorts to Ranging: BCH Market
Key Levels:
Resistance levels: $140, $160, $180
Support levels: $100, $90, $80
The daily chart showcases the BCH market resorts to raging motions above the lower bearish trend line drawn southward. The 14-day SMA indicator has trended far to the south above the current trading spot underneath the 50-day SMA indicator. The upper bearish trend line drew closely over the bigger SMA. The Stochastic Oscillators have strived to travel northbound into the overbought region. And they are still pointing in the north direction to indicate that an upward force is ongoing.
What the best resistance area will be ideal for the BCH/USD market bears to resurface?
As the BCH/USD market operation resorts to ranging motions currently, the best resistance area for bears to resurface will be around the $150 level to reshape the downward trend at its usual point of getting a sell signal to reorder. Launching a buying order at this moment may not be timely, running into a profit margin. But, in the womb of time, it will run. Long-position takers needed to be wary of overleveraging their positions to avoid the unnecessary whipsawed-trading condition in no time.
On the downside of the technical analysis, the BCH/USD market operation needed to run into resistances between $143 and $225 levels before getting a reliable sell signal while the price encounters variant rejections in the presumed trading zones. The upward forces toward achieving that seem to be forthcoming on a gradual moving mode. Short-position takers needed to be cautious of following the trend while the lower bearish trend line breached suddenly to the downside.
BCH/BTC Price Analysis
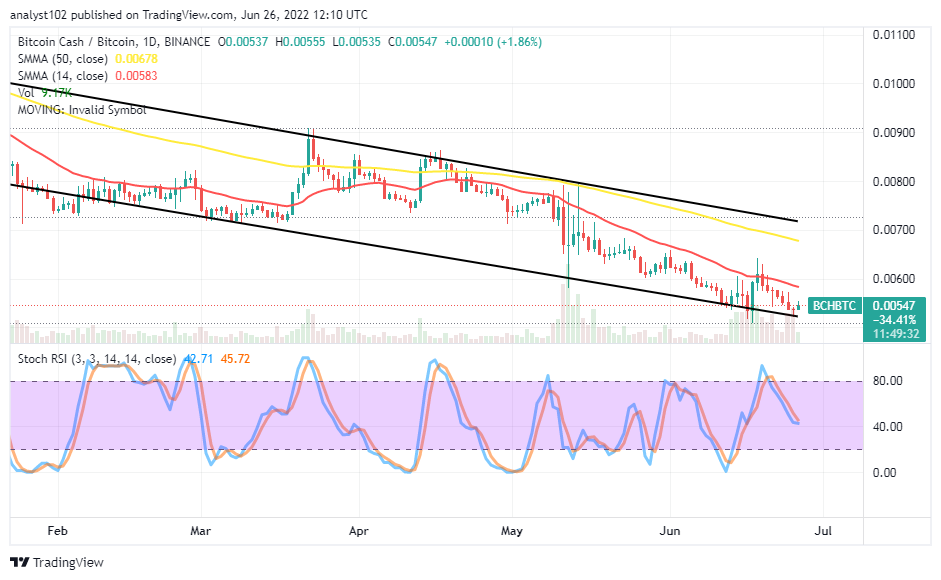
In comparison, Bitcoin Cash appears, getting set to push against the trending force of Bitcoin. The cryptocurrency pair price resorts to ranging on a high mode between the lower bearish trend line and the smaller SMA trend line. The 14-day SMA indicator is underneath the 50-day SMA indicator. The Stochastic Oscillators have southbound positioned around the range of 40. The counter crypto may be getting a reduction in its trending power against the base crypto. Price may have to stay for a while at a lower trading zone to build a strong support baseline around the lower bearish trend line.
Looking to buy or trade Bitcoin Cash (BCH) now? In-Content Heroes link!
68% of retail investor accounts lose money when trading CFDs with this provider.
Read more:
Join Our Telegram channel to stay up to date on breaking news coverage


