Join Our Telegram channel to stay up to date on breaking news coverage
BCH Price Prediction – June 20
The Bitcoin Cash continues to lag as the technical indicator suggests that lateral trade may prevail in the short term.
BCH/USD Market
Key Levels:
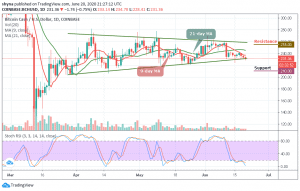
Resistance levels: $255, $275, $295
Support levels: $210, $190, $170

For the past few days, BCH/USD price has been following a downtrend towards the $228 level. Today, the technical indicator shows that the Bitcoin Cash is slightly oversold as the signal lines slide into the oversold territory. However, after the current price fall, the Bitcoin Cash price might see an uptrend in the coming week.
Moreover, BCH/USD seems to be picked up its pace and touches $234 today before dropping but the coin is still trading below the 9-day and 21-day MA. Early this week, the Bitcoin Cash has been showing an uneven movement with several rises and falls. We will discover that the coin has not been able to maintain a consistent bullish run but it may start to show signs of a downward movement slowly from the latter part of the day.
On the upside, the bulls could break above the moving averages, and approach to retest the $255, $275, and $295 resistance levels. The primary support holds ground at $220 while $215 may try to stop the losses in case of a reversal. Therefore the potential supports at $210, $190, and $170 are very important. Meanwhile, the stochastic RSI suggests more bearish signals.
Comparing with Bitcoin, BCH performance has been very low due to a recurring bearish sentiment which is causing the downfall of the coin. As the price falls, sellers are seen posing an additional threat for buyers to reach the support level of 0.0247 BTC where the nearest target is located. However, an eventual break below the lower side of the channel may cause the coin to collapse more.

However, for a positive upsurge, the 0.0270 BTC and 0.0280 BTC are the major resistance levels for the coin for now. Therefore, more negative spikes could retest the important support at the 0.0240 BTC before a possible slip to 0.0235 BTC and below. The trading volume is fading away while the RSI (14) is moving below 40-level, suggesting more downtrends.
Join Our Telegram channel to stay up to date on breaking news coverage