Join Our Telegram channel to stay up to date on breaking news coverage
BCH Price Prediction – March 19
BCH/USD trading activities still showcase variant potentials of surging northbound as price returns on the account of featuring small-lengthy of higher-lows a bit over a critical support level of $500.
BCH/USD Market
Key Levels:
Resistance levels: $650, $750, $850
Support levels: $400, $350, $300
BCH/USD – Daily Chart
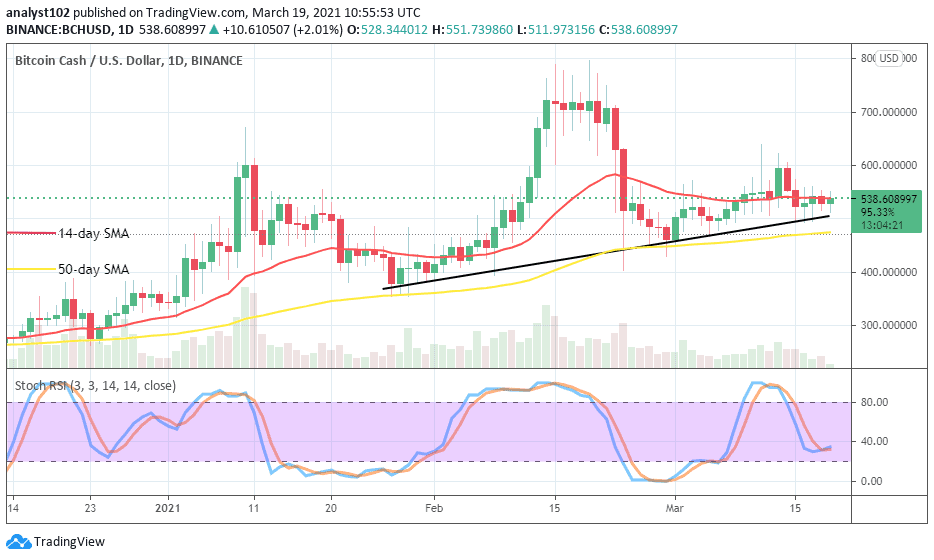
The BCH/USD daily trading chart depicts that over time there have been a series of short higher-lows being formed on the buying side of the bullish trend-line. That shows that more buying moments are still in the offing. The 50-day SMA trend-line is underneath the 14-day SMA trading indicator. The smaller SMA briefly points to the east alongside the trading spot of the crypto-market. The Stochastic Oscillators are attempting to close the hairs a bit below range 40. That raises the need to get to see more ups in a near session.
Will BCH/USD market prolong trading below the $600 resistance level?
There has been a necessary upward price reversal move that has touched low support of the $500 line in the BCH/USD market operations. It is now expected of the crypto-bulls to muster up the energy to breathe life back into the bullish trend of this market. However, the current price resistance level is been found around $600 point. Therefore, an aggressive move is required to suggest decency in a buy positional entry.
About the falling trading situation of this crypto-market, bears have to patiently await crypto’s price approaching a previous high of $700 to see whether there will be a pit stop around the key resistance value. However, a sudden breakdown of the support line of $500 may potentially result in setting selling-traders on a whipsawed note.
BCH/BTC Price Analysis
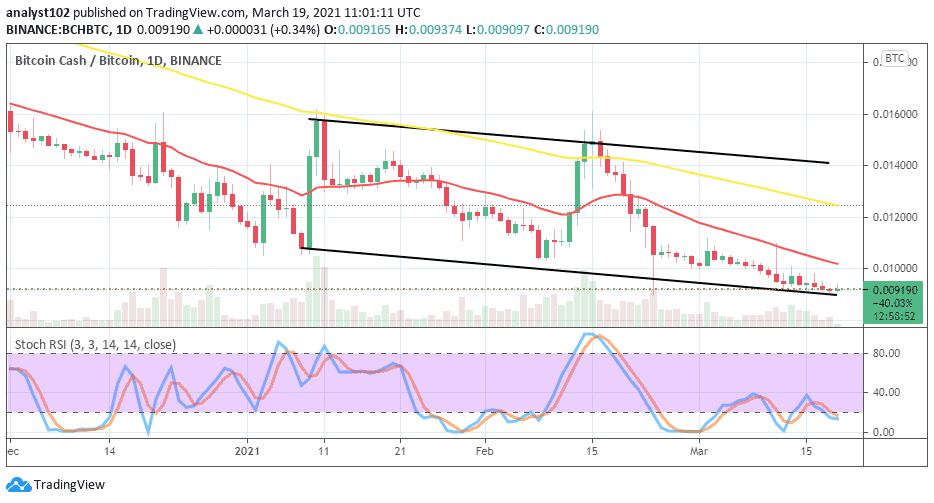
Comparing the market valuation between BCH and BTC shows that to some extent, the counter-crypto outweighs the worth of the base-crypto until now. Although, Bitcoin Cash pushes are characterized by Shorty lower-lows below the trend-line of the 14-day SMA. The 50-day SMA indicator is situated above the smaller SMA. The lower channel has also been tightly pushed against the south. That shows the degree of pressures being inflicted on the base-instrument by the counter-tool. However, the downward pressures are getting to a point that Bitcoin Cash will soon regain its lost momentum.
Join Our Telegram channel to stay up to date on breaking news coverage


