Join Our Telegram channel to stay up to date on breaking news coverage
BCH Price Prediction – June 28
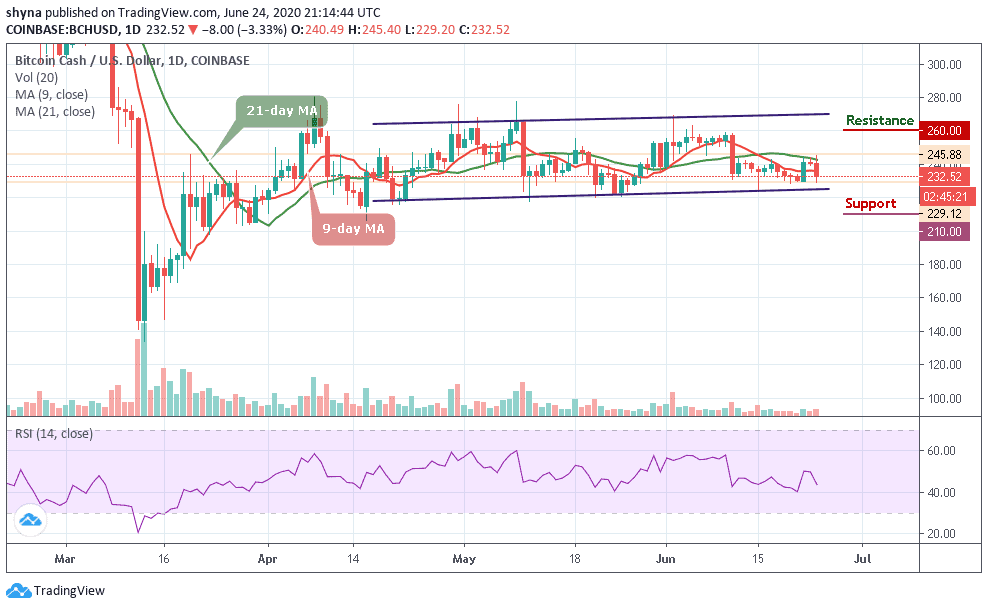
Bitcoin Cash remains range-bound with the short-term outlook and still ranging well within the channel.
BCH/USD Market
Key Levels:
Resistance levels: $235, $255, $275
Support levels: $195, $175, $155
BCH/USD is seen moving with several falls more than rises and it has not been able to maintain a consistent bullish run. Meanwhile, for the past few days, the market has been facing a serious downtrend below the 9-day and 21-day moving averages within the channel. Looking at the daily chart, BCH/USD price has continued to consolidate itself in a flag formation, which may likely cross below the lower boundary of the channel.
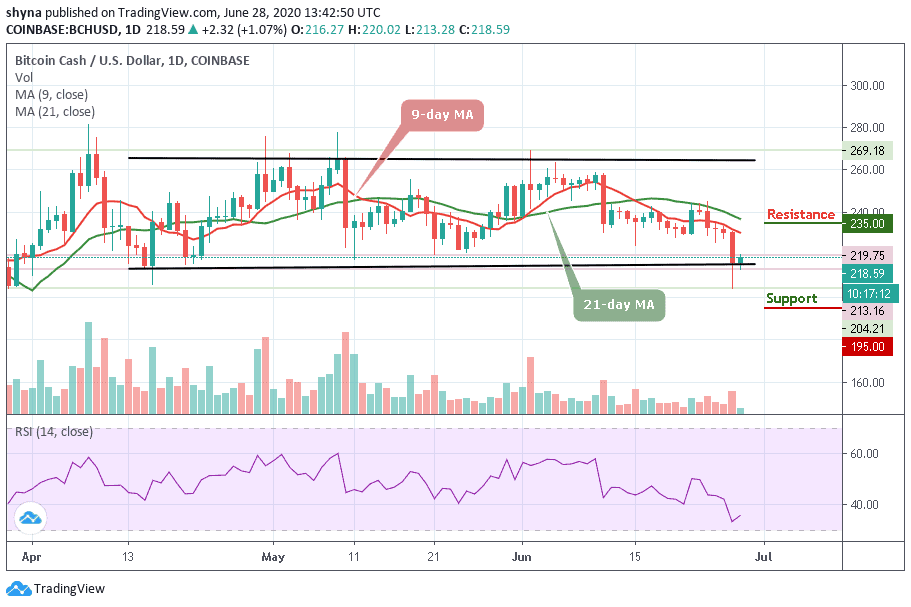
More so, the daily breakdown reveals that BCH/USD before touching $219.75, dropped to $213.16 at the opening of the market today after which it corrected itself to where it is trading currently at $218.59 level. If the support gets weak, a price break-down may occur as the bears may find new weekly lows at $195, $175, and $155 support levels.
Nevertheless, a bullish continuation may continue to roll the market to $230 resistance with a possible break above the moving averages and could hit the $235, $255, and $275 resistance levels, establishing a new high for the market. At the moment, the RSI (14) is making a quick return back to the north, moving towards 40-level.
Against Bitcoin, BCH performance is still very low due to a recurring bearish sentiment which has caused the market to fall drastically yesterday. As the price falls, sellers are posing an additional threat for buyers to reach the 0.024 BTC where the nearest target is located. In addition, any eventual break below the lower side of the channel may cause the coin to collapse.
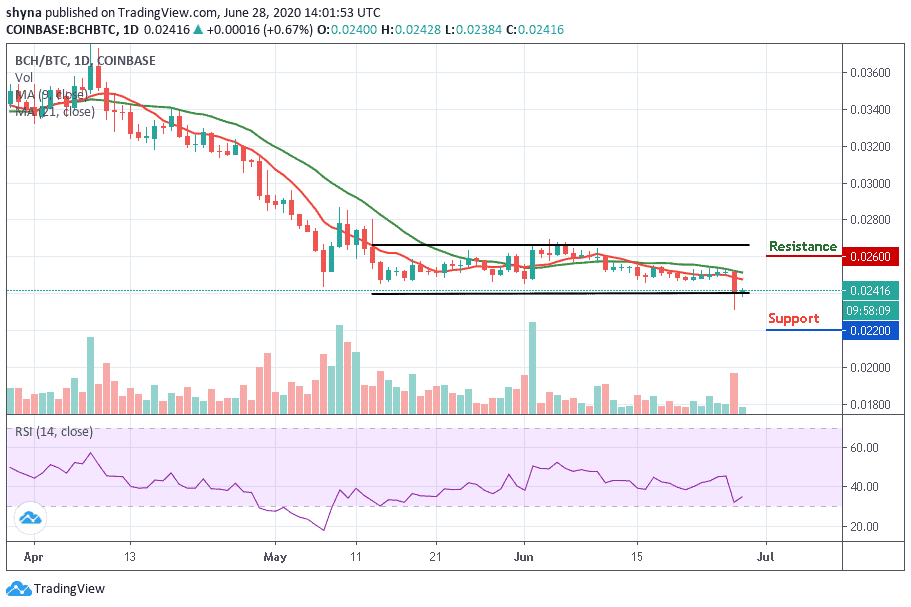
Meanwhile, for a positive upsurge, the 0.026 BTC and above are the major resistance levels for the coin for now. Therefore, a bearish continuation could test the important support at the 0.022 BTC and below. The technical indicator RSI (14) is facing up, waiting for buying pressure.
Join Our Telegram channel to stay up to date on breaking news coverage