Join Our Telegram channel to stay up to date on breaking news coverage
LTC Price Prediction – June 28
LTCUSD remains in the bearish movement after the recent reversal embraced support at $39.17.
LTC/USD Market
Key Levels:
Resistance levels: $44, $46, $48
Support levels: $38, $36, $34

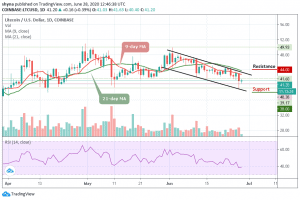
LTC/USD is trading with 0.39% after touching the low of $40.38 today amid global correction on the cryptocurrency market. The Litecoin (LTC) is changing hands at $41.12 after touching the high of $41.60 in the early hours of today. The coin may continue to settle below the 9-day and 21-day moving averages at $40, which now serves as an initial support level.
However, if the support of $40 gives way, the sell-off may come to focus and it may be extended below the channel. At the moment, the bearish scenario seems more dominant as sellers continue to post firm commitments into the market. We could see a sharp drop in support of $39. Breaking the aforementioned support could further weaken the market to $38, $36 and $34.
On the upside, a higher possible swing may likely retest the previous resistance levels at $42 and $43. However, if the bulls manage to fuel the market with the mentioned resistance levels, traders may expect a further increase to $44, $46, and $48 resistance levels. RSI (14) is now moving below 40-level, indicating the latest selling pressure on the market.
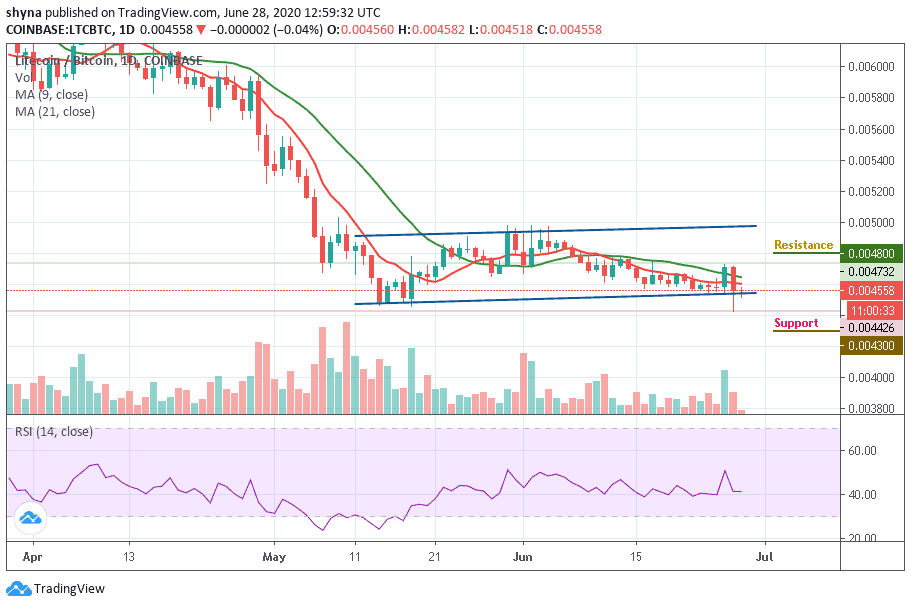
Comparing LTC with BTC, we can easily see that the pair is breaking below the 9-day and 21-day moving averages from the daily high of 4580 SAT. Litecoin price could see another sharp drop if it crosses below the channel. Breaking this barrier could further take the price to the critical support levels at 4300 SAT and 4100 SAT.

However, the Litecoin price is trading at 4558 SAT level, if the bulls can hold the price as it is and move the market upward, the next key resistance levels lie at 4700 SAT respectively. Reaching these levels might take it to the potential resistance levels of 4800 SAT and 5000 SAT. Meanwhile, the RSI (14) is seen moving in the same direction, indicating a sideways movement.
Join Our Telegram channel to stay up to date on breaking news coverage

