Join Our Telegram channel to stay up to date on breaking news coverage
BCH Price Prediction – April 19
Following the past few days of price actions, BCH/USD is consolidating above the moving averages.
BCH/USD Market
Key Levels:
Resistance levels: $300, $320, $340
Support levels: $180, $160, $140
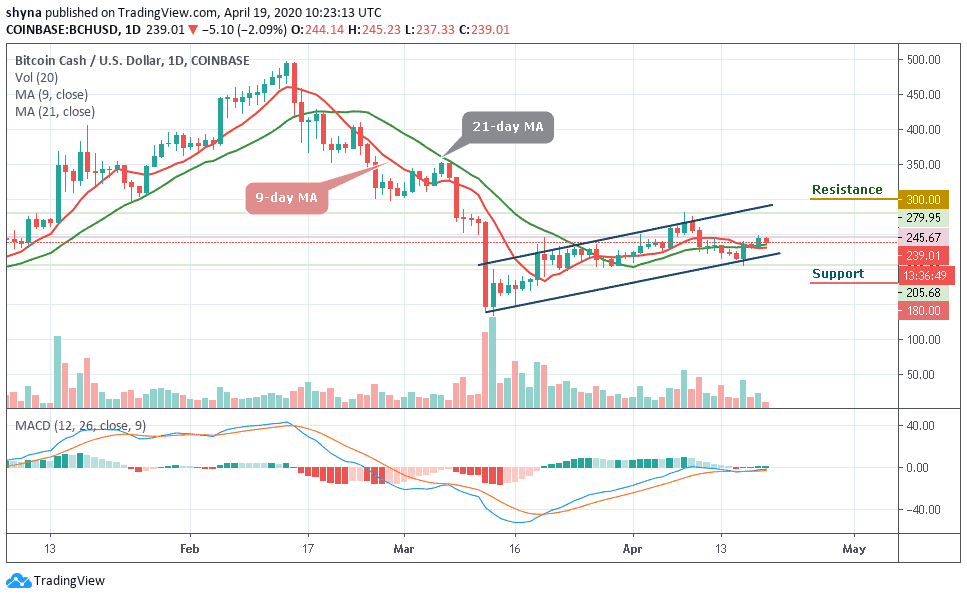
BCH/USD bulls have been fighting almost a week now to come out of the valley they were pushed into during last week’s declines. Another fall in the price, which started today, is spotted on the chart too. From the past few days, the market is forming a pattern where the day begins with either having an uptrend or downtrend, but towards the end, it reverses.
Looking at the daily chart, BCH/USD price has continued to consolidate itself in a flag formation, waiting for a potential move towards the north or break below the 9-day and 21-day moving averages. The daily breakdown shows us that BCH/USD had dropped to $235.67 after correcting itself to $245.67 level. If the support gets weak, a price break-down may occur as the bears may find new lows at $180, $160 and $140 support levels.
Notwithstanding, a bullish step back may likely roll the market back to $300 resistance with a possible break out of the channel and move towards the $320 and $340 resistance levels, establishing a new monthly high for the market. At the moment, the signal lines of MACD are yet to cross into the positive side as they move in the same direction. Meanwhile, a possible bull cross might reveal a buy signal for the market.
Against BTC, the recent sideways movement is due to the price stability in BCH trading which shows that the resistance-support is at equilibrium. Another thing to note here is that the market is preparing to change the trend and a short-term bearish breakout is most likely to play out because the technical indicator RSI (14) moves below the 46-level and this could find the nearest support levels at 0.031 BTC and below.
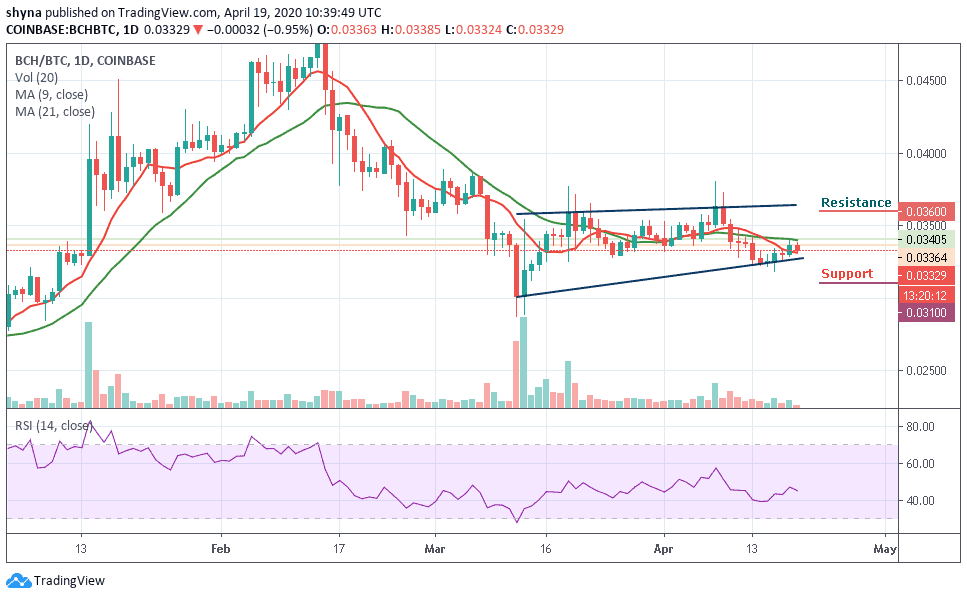
However, the only condition for the bullish trend is if the 0.032 BTC level can continue to provide support for the market, then the price may be pushed to the resistance level of 0.036 BTC and above. Meanwhile, the BCH/BTC pair continues to remain in a sideways movement hovering within the moving averages.
Please note: Insidebitcoins.com is not a financial advisor. Do your research before investing your funds in any financial asset or presented product or event. We are not responsible for your investing results.
Join Our Telegram channel to stay up to date on breaking news coverage