Join Our Telegram channel to stay up to date on breaking news coverage
Bitcoin Cash Price Prediction – March 1
The Bitcoin Cash price prediction couldn’t stay above the upper boundary of the channel as the coin could settle in consolidation.
BCH/USD Market
Key Levels:
Resistance levels: $380, $400, $420
Support levels: $280, $260, $240

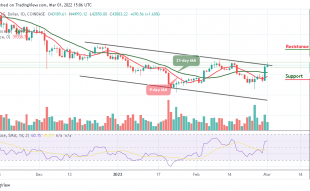
According to the daily chart, BCH/USD is pushing for consolidation around $325, but the trend has a bearish inclination, which may likely test the support at $300 as it could move below the 9-day and 21-day moving averages. The technical indicator remained bearish as the Relative Strength Index (14) nosedives below 60-level.
Bitcoin Cash Price Prediction: BCH Price May Go Further Lower
The Bitcoin Cash price is likely to test the nearest support at $320, but the best the bulls can do is to defend the support at this level and focus on pulling towards $300. In the past few weeks, the Bitcoin Cash lost balance alongside other cryptos, and the sharp drop affected the buyers from an attempted recovery above the moving averages. As it is now, any further bearish movement towards the lower boundary of the channel could hit the supports at $280, $260, and $240 respectively.
Moreover, the coin is already trading averagely and therefore a slight bullish action is expected to correct the declines with a possible jump above $350. Meanwhile, if there is an increase in buying pressure, the price may break above the upper boundary of the channel to reach the resistance levels of $380, $400, and $420.
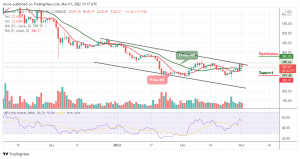
Against Bitcoin, the bears are still showing more commitment to the trading as the market price follows the negative signs since yesterday, therefore, the coin may continue to follow the downtrend as much as the buyers failed to push the price above the 9-day and 21-day moving averages.
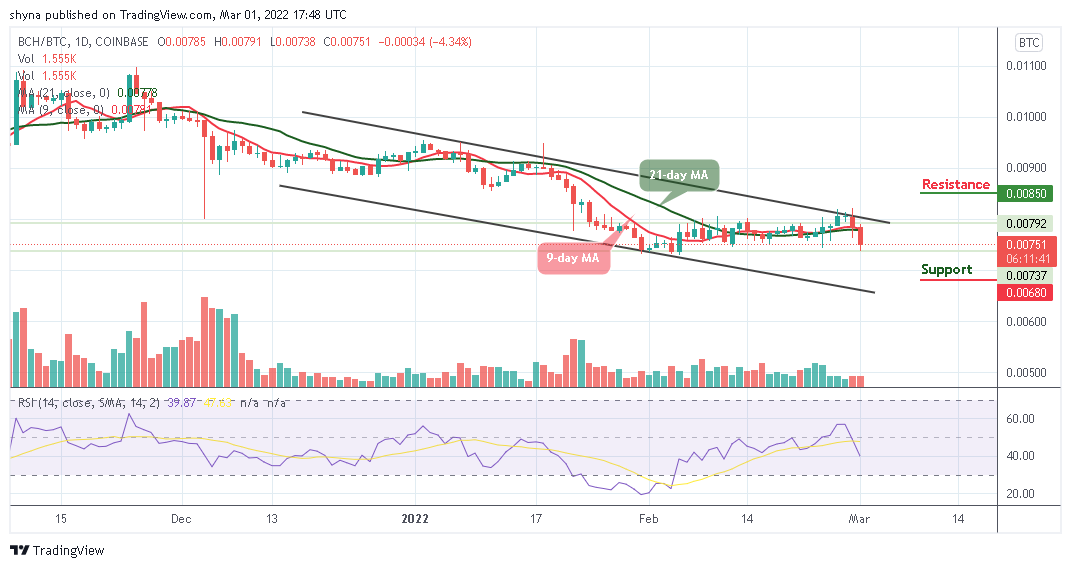
However, as the signal line of Relative Strength Index (14) moves to cross below 40-level, going further below may cause the coin to continue the downward movement to touch the support level of 680 SAT and below, but a rebound above the moving averages could take the Bitcoin Cash price to the resistance level of 850 SAT and above.
Looking to buy or trade Bitcoin Cash (BCH) now? Invest at eToro!
68% of retail investor accounts lose money when trading CFDs with this provider
Read more:
- How to buy Bitcoin Cash
- How to buy Cryptocurrency
Join Our Telegram channel to stay up to date on breaking news coverage