Join Our Telegram channel to stay up to date on breaking news coverage
BCH Price Prediction – April 27
The BCH/USD market valuation has begun to get some pushes from a low support line of $700 during the recent price downward correctional moves.
BCH/USD Market
Key Levels:
Resistance levels: $1,000, $1,200, $1,300
Support levels: $700, $600, $500
BCH/USD – Daily Chart
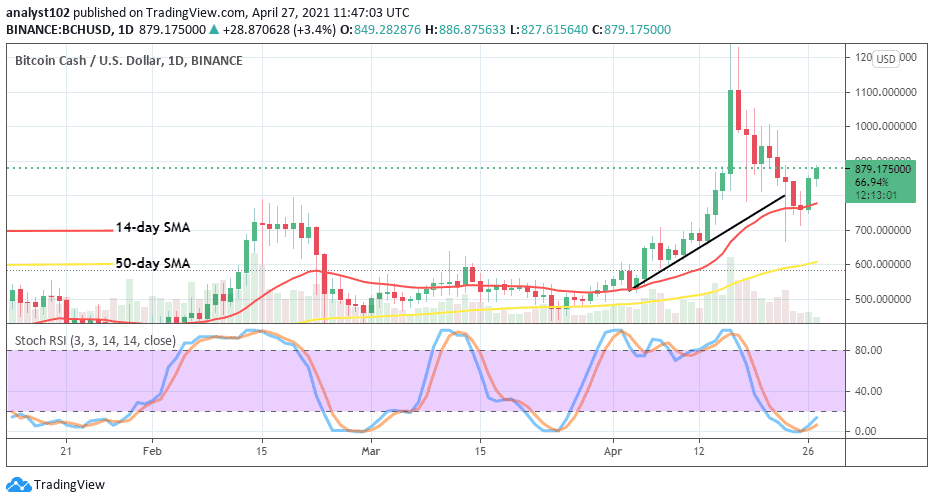
Taking a deep look at the BCH/USD daily market chart, it shows that most of the time that a downward move takes up space, price uses to find a support level around its smaller SMA trend-line. Though, at times a short-lived breakdown of it as well plays out in the process. The 50-day SMA indicator is yet underneath the 14-day SMA trend-line with the bullish trend-line drawn closely to face an upward direction to now indicate immediate support at the $800 line. The Stochastic Oscillators are dipped in the oversold region trying to open the hairs towards the north. That signifies the possible return of an uptrend in the near time.
Will BCH/USD move backward to revisit its previous $700 low value?
The BCH/USD market point of $700 has come to be the vital line in the determination of ongoing upswing. And, yet, the current upside trading position has not been taken far away from the trading zone. However, strong indications are signaling the potential of seeing more movements to the north in the near trading sessions.
It would be more technically accepted that bears should stay away from placing any counter order against the already established uptrend. Therefore, it would make a whole lot of sense to wait for rejection possibly in between $1,100 and $1,200 levels to occur at a later session to be able to reconsider the sell order entry. However, if price holds strong between those zones, it could lead to a consolidation that may eventually nullify the bears’ position further.
BCH/BTC Price Analysis
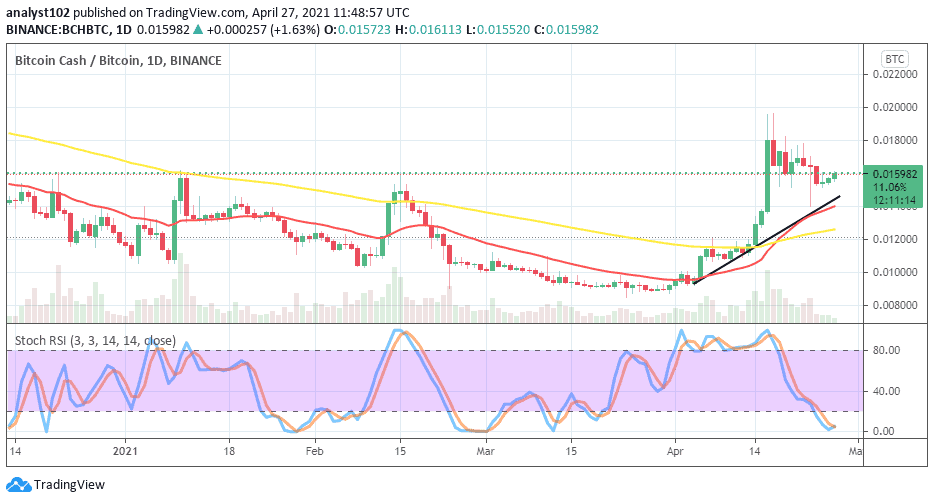
In comparison, BTC is still struggling retard the appreciation moving spree of BCH until the present time of writing. In attestation to that, a series of variant higher lows has surfaced a bit over the smaller SMA trend-line. The 50-day SMA indicator is underneath the 14-day SMA. The Stochastic Oscillators have moved down into the oversold region to show the weakness of the counter trading tool in its wake to resist the power of the base crypto. As a result, BCH will still dominate the space against BTC for a while.
Join Our Telegram channel to stay up to date on breaking news coverage


