Join Our Telegram channel to stay up to date on breaking news coverage
Bitcoin Cash Price Prediction – March 20
The Bitcoin Cash price prediction shows that BCH dips below $330 today as the coin may likely reclaim the losses if the bulls play out.
BCH/USD Market
Key Levels:
Resistance levels: $400, $420, $440
Support levels: $250, $230, $210

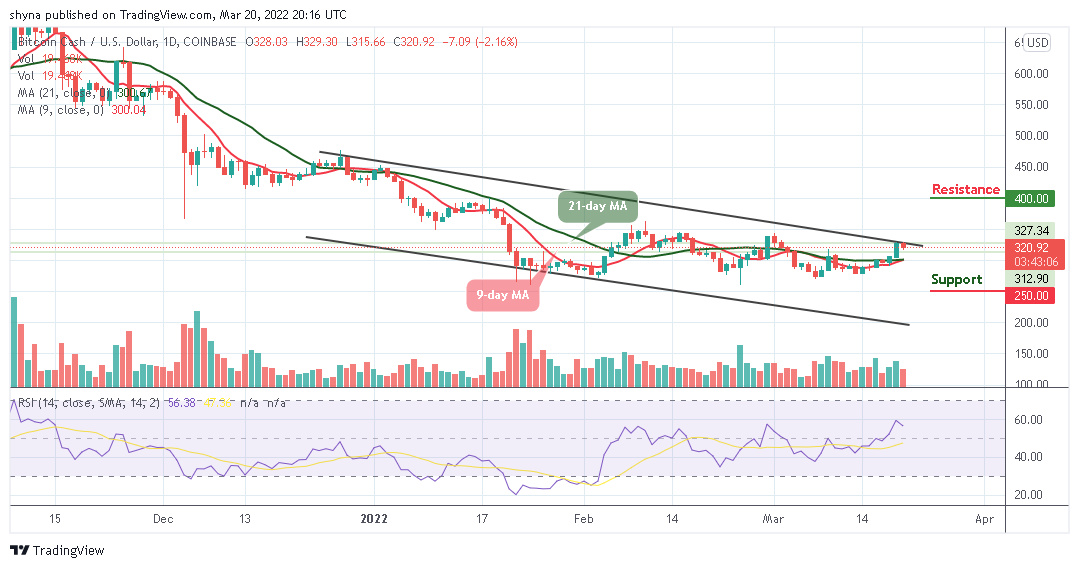
BCH/USD is moving downward as the coin is hovering above the 9-day and 21-day moving averages with a bearish inclination, which may likely retest the support at $300. Looking at the technical indicator, the Relative Strength Index (14) nosedives below 60-level to confirm the bearish movement.
Bitcoin Cash Price Prediction: Would Bitcoin Cash Spike to the Upside?
According to the daily chart, the Bitcoin Cash price is likely to face the downtrend, but the bulls may need to defend the support at $295 and focus on pulling the price towards the $280 level. However, BCH/USD is making an effort to push the price back to the upside, and it is also looking forward to reclaiming the ground above $330.
Meanwhile, crossing above the upper boundary of the channel may cause the market to reach the resistance levels of $400, $420, and $440 respectively. In the meantime, if the coin decides to follow the negative side, a minimum swing could bring the price to a $270 support level. Exceeding this level could take the price to the support levels of $250, $230, and $210 by sliding towards the lower boundary of the channel.
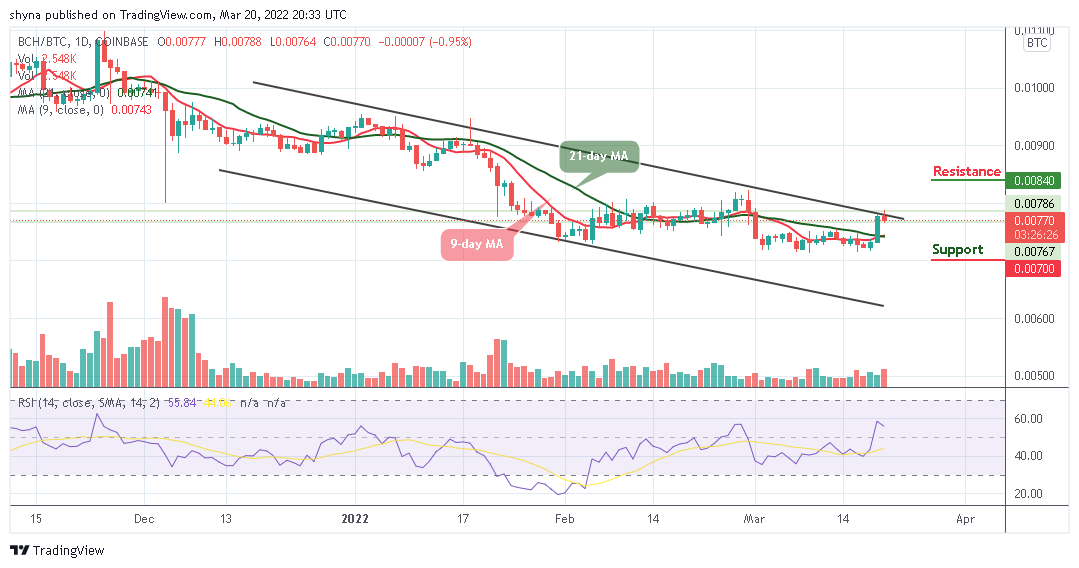
When compared with Bitcoin, the Bitcoin Cash price is currently hovering above the 9-day and 21-day moving averages. According to the recent negative sign, the trend may likely follow the downtrend if the buyers failed to push the price above the upper boundary of the channel.

However, as the technical indicator Relative Strength Index (14) stays below 60-level, any further downtrend could lower the price to the support level of 700 SAT and below, but once it moves out of this zone, the market price may likely begin an upward trend and could push the coin towards the resistance level of 840 SAT and above.
Looking to buy or trade Bitcoin Cash (BCH) now? Invest at eToro!
68% of retail investor accounts lose money when trading CFDs with this provider
Read more:
Join Our Telegram channel to stay up to date on breaking news coverage

