Join Our Telegram channel to stay up to date on breaking news coverage
BCH Price Prediction – April 21
After BCH/USD touched $249 level some days ago, the coin has not been able to move above the level again.
BCH/USD Market
Key Levels:
Resistance levels: $278, $288, $298
Support levels: $156, $146, $136

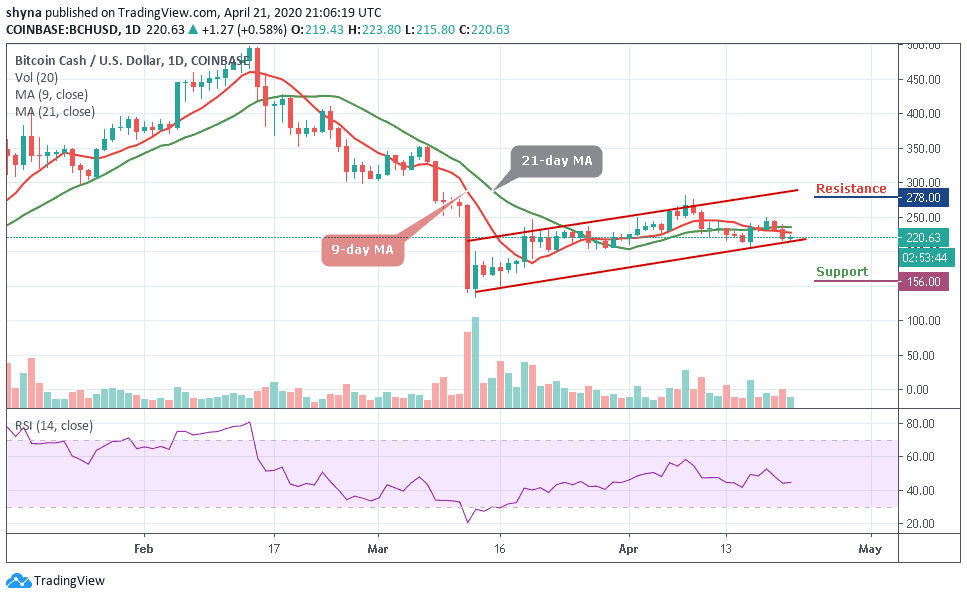
The BCH/USD peaked at $249.41 on April 18, 2020, and has been trying to maintain the trend as the price consolidates within the channel. Meanwhile, for the price not to stay above $250 ruins the long-term technical picture of the coin. More so, the coin will have to hold this ground to guide against the downward pressure. If not, the downside may likely grow, with the next goal supporting $156, $146 and $136 levels.
However, the BCH price is currently trading at $220.63 and trading below the 9-day and 21-day moving averages. On the upside, a sustained move above $this level may ease the initial downside pressure and create momentum for the bulls with the focus to move the market to the next resistance levels of $278, $288 and $298 respectively. At the moment, RSI (14) is currently moving above 40-level in the same direction, which indicates that the market might go on sideways.
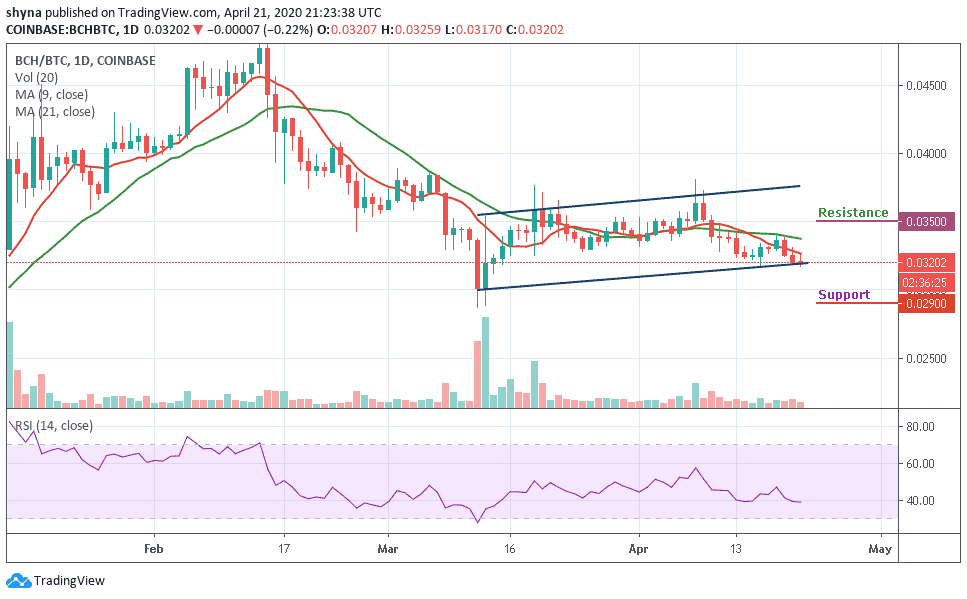
Against Bitcoin, as revealed in the daily chart, the bears have shown a little commitment to BCH trading. Following the recent negative sign, the trend may continue to go down if the sellers can continue to pump more pressure into the market further.

More so, as the RSI (14) is hovering around 40-level, if the buyers can hold the support of 0.031 BTC, the market price may likely resume an upward trend and cross the moving average of 21-day to touch the resistance level of 0.035 BTC and above but a retest could lower the price to 0.029 BTC and below.
Please note: Insidebitcoins.com is not a financial advisor. Do your research before investing your funds in any financial asset or presented product or event. We are not responsible for your investing results.
Join Our Telegram channel to stay up to date on breaking news coverage

