Join Our Telegram channel to stay up to date on breaking news coverage
BCH Price Prediction – May 19
As Bitcoin Cash extends its bullish action above $250, declines swept in pushing it back under $248.
BCH/USD Market
Key Levels:
Resistance levels: $280, $300, $320
Support levels: $200, $180, $160

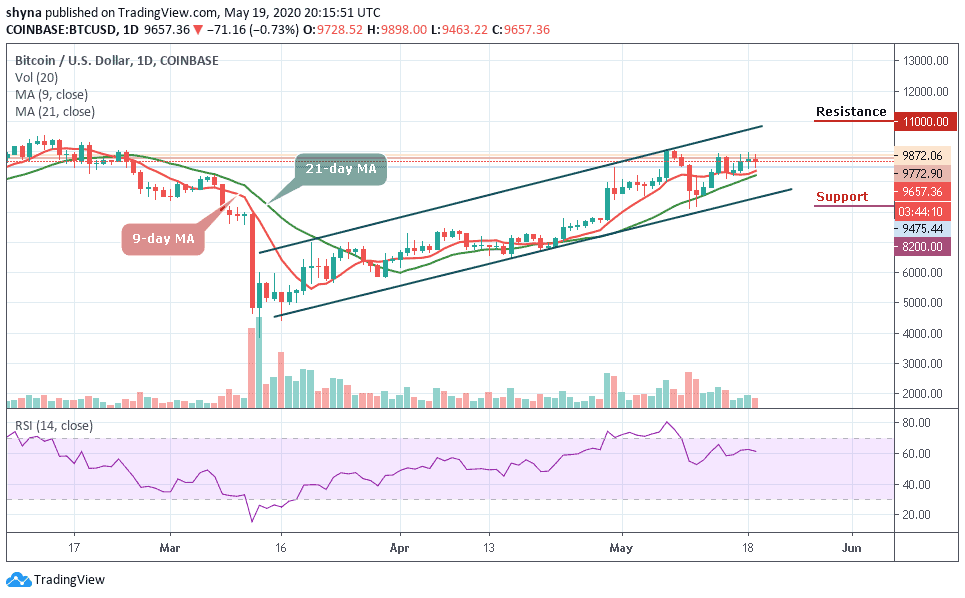
Since BCH/USD couldn’t break above the 21-day moving average, the price has had a bearish inclination and became an uphill task to sustain the gains above the critical $245 due to the renewed bearish momentum emanating from the rejection around $251. Bitcoin Cash (BCH) price is currently down with 0.93%, and the value touches the low of $239 today.
Furthermore, looking at the chart, we can easily observe that BCH/USD is changing hands at $245.83 and if the market price drops further and move below the 9-day moving average by breaking down the lower boundary of the channel, it is likely to produce a huge red candle to the downside, marking supports at $200, $180, $160 levels and below.
Meanwhile, a strong buying pressure may take the price back above the moving averages and to the resistance level of $260. While trading at $270, a bullish step back is likely to roll the market to the resistance levels of $280, $300 and $320, establishing a new high for the market. In other words, the RSI (14) is moving below level 51, indicating a sideways movement.
Looking at the daily chart while comparing it with BTC, we can observe that the traders are yet to show a strong commitment to buying in the market. Meanwhile, in as much as the bulls turn strong now, we may expect the market to roll back to the 0.028 BTC and 0.029 BTC resistance levels.
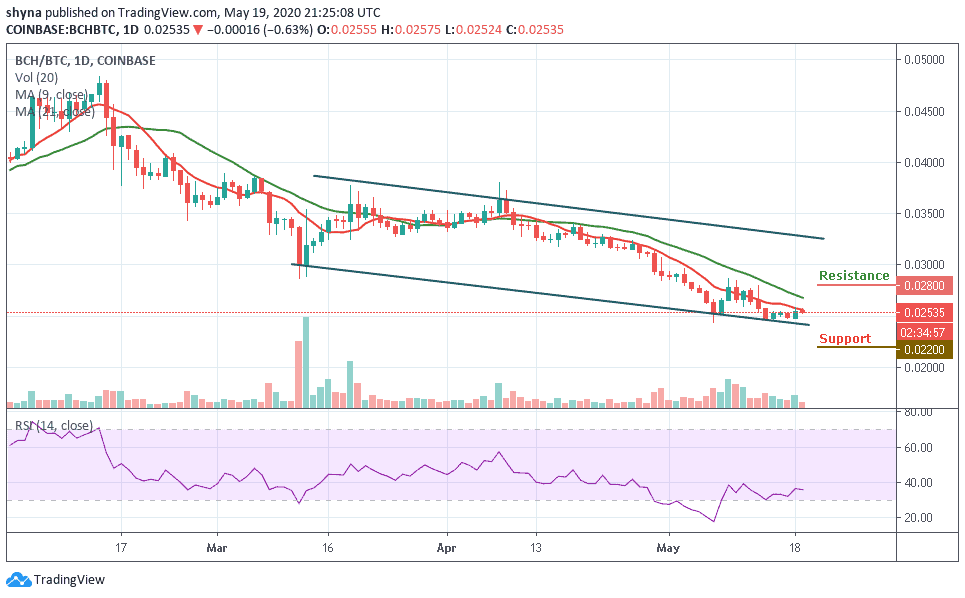
However, the 0.022 BTC and 0.021 BTC levels may likely produce support for the market should in case the buyers failed to push the price to the north. Whichever way, the BCH/BTC pair continues to remain in a downward range while the RSI (14) signal line moves below the 40-level.
Please note: Insidebitcoins.com is not a financial advisor. Do your research before investing your funds in any financial asset or presented product or event. We are not responsible for your investing results.
Join Our Telegram channel to stay up to date on breaking news coverage