Join Our Telegram channel to stay up to date on breaking news coverage
Bitcoin (BTC) Price Prediction – May 19
Severally, BTC/USD attempts to break above $10,000 nullified as selling pressure intensifies.
BTC/USD Long-term Trend: Bullish (Daily Chart)
Key levels:
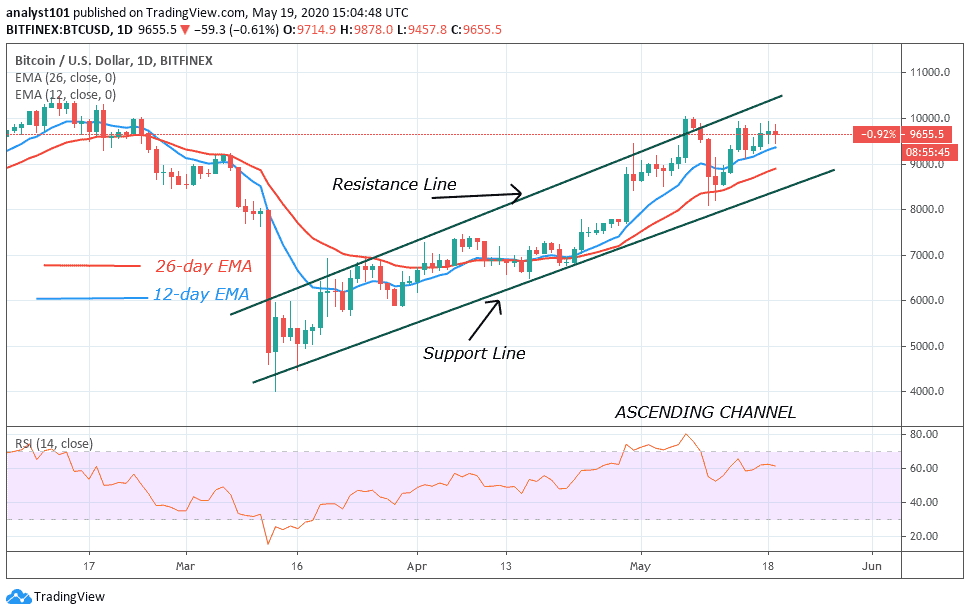
Resistance Levels: $11,000, $11,200, $11,400
Support Levels: $8,200, $8,000, $7,800
BTC/USD progress over the last couple of weeks is in jeopardy following the failure to breach the $10,000 level. The initial surge from lows around $8,100 hit a wall within a whisker of $10,000 a few days ago. A reversal from this zone confirmed support above $9,000 but the bulls, not giving up, launched another attack on $10,000 which also failed yesterday.
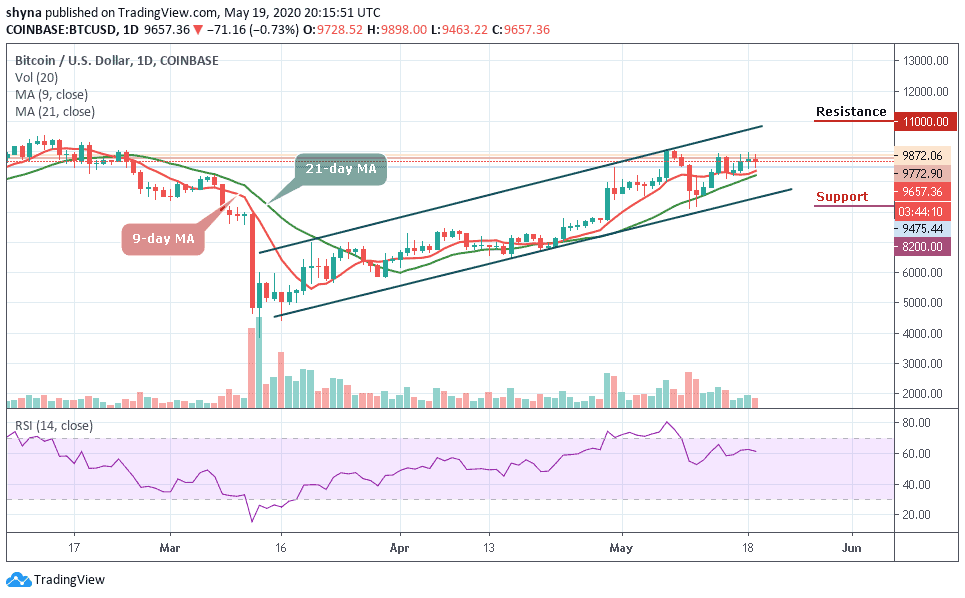
However, should the $9,400 support be reclaimed; it’s possible that the price may drop below the 9-day and 21-day moving averages. A possible bearish scenario that could play out after the rejection at $9,872 may cause the Bitcoin price to fall below the channel. More so, losing that zone may allow the coin to reach the support levels of $8,200, $8,000 and $7,800 as the RSI (14) signal line is moving above 60-level.
In the short-term, holding the zone between the 9-day MA and $9,500 support is crucial or a retest of the $9,400 support is likely. But currently, BTC/USD is yet to make a lower low under the $9,600 support. So, a short phase of consolidation leading to resistance levels of $11,000, $11,200, and $11,400 is more likely than a drop below key support levels.
BTC/USD Medium – Term Trend: Ranging (4H Chart)
The Bitcoin price is currently moving around the $9,672 after touching the high of $9,901 today. Looking at the chart, we can see that the bearish supply may be turning heavy in the market, but the bulls are trying to defend the $9,500 support as well. Meanwhile, the $9,200, $9,000, and $8,800 support levels may come into play if the coin breaks the mentioned support.
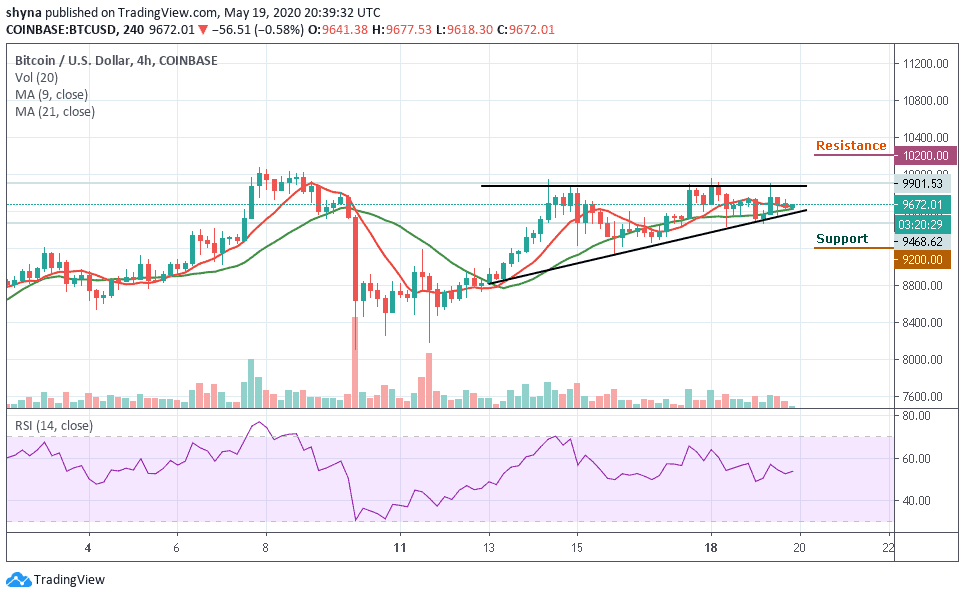
However, if the buyers can reinforce and power the market, we can expect a retest at the $9,900 resistance level. Breaking the mentioned resistance may further allow the bulls to test the $10,200 and $10,400 on the upside. In other words, Bitcoin is currently consolidating and moving sideways on the medium-term outlook. We can expect a surge in volatility to occur as the RSI (14) faces downtrend.
Please note: Insidebitcoins.com is not a financial advisor. Do your research before investing your funds in any financial asset or presented product or event. We are not responsible for your investing results.
Join Our Telegram channel to stay up to date on breaking news coverage