Join Our Telegram channel to stay up to date on breaking news coverage
Bitcoin (BTC) Price Prediction – May 19, 2020
On the daily chart, BTC/USD bulls have comfortably tested the $10,000 resistance zone on three occasions without breaching it. The only achievement is that the resistance zone has been weakened after several retests. The king coin is now in a range-bound movement below the resistance at $10,000.
Key Levels:
Resistance Levels: $10,000, $11, 000, $12,000
Support Levels: $7,000, $6,000, $5,000
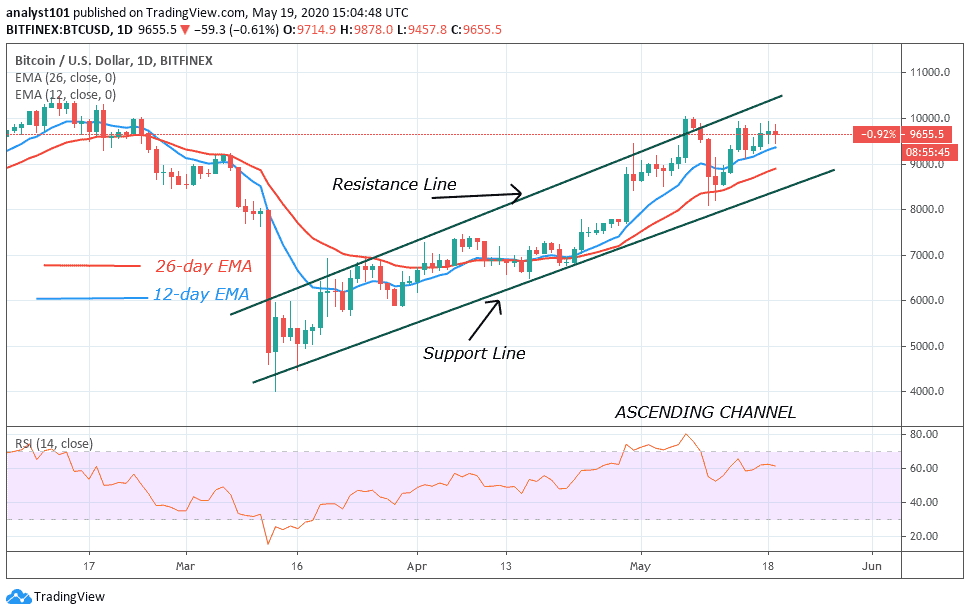
Bitcoin is in a range bound move after three unsuccessful attempts at the resistance. The frequent retest at the resistance becomes possible because of an upside correction. The upside correction is a range between $9,200 and $10,000. Each time the bulls are resisted, price will fall to the lower price range for another upward move. In the upside range, the bulls can retest the resistance zone. In the downside range, Bitcoin finds support between $8,200 and $8,500 before the resumption of the uptrend. The downtrend will resume if the bulls lose possession of $8,200 support.
Meanwhile, Bitcoin is trading below the resistance zone. The retest will continue as long as price is above $9,200 support. Since yesterday the price action has been indicating small body candlesticks like Doji and Spinning tops. This candlesticks indicates that buyers and sellers are exhausted and undecided about the direction of the market. The king coin is at level 62 of the Relative Strength Index. This indicates that the coin is in an uptrend zone and the bulls are in control.
BTC/USD Medium-term Trend: Bullish (4-Hour Chart)
On the 4 hour chart, the crypto is in a sideways trend. Since on May 7, Bitcoin has been on a sideways trend below the overhead resistance. The bulls have made several retests while in a sideways trend.

On May 8, the market reached a high of $10,014 but was resisted as BTC slumped to $8,200 low. The price made a downward correction and rallied to the previous highs. The king coin has been trading in the upper region close to the overhead resistance. The bottom line is that BTC will drop again to the downside if the bulls fail to breach the overhead resistance. Nevertheless, BTC is above 40% range of the daily stochastic , indicating that it is in a bullish momentum.
Please note: Insidebitcoins.com is not a financial advisor. Do your research before investing your funds in any financial asset or presented product or event. We are not responsible for your investing results.
Join Our Telegram channel to stay up to date on breaking news coverage