Join Our Telegram channel to stay up to date on breaking news coverage
BCH Price Prediction – January 18
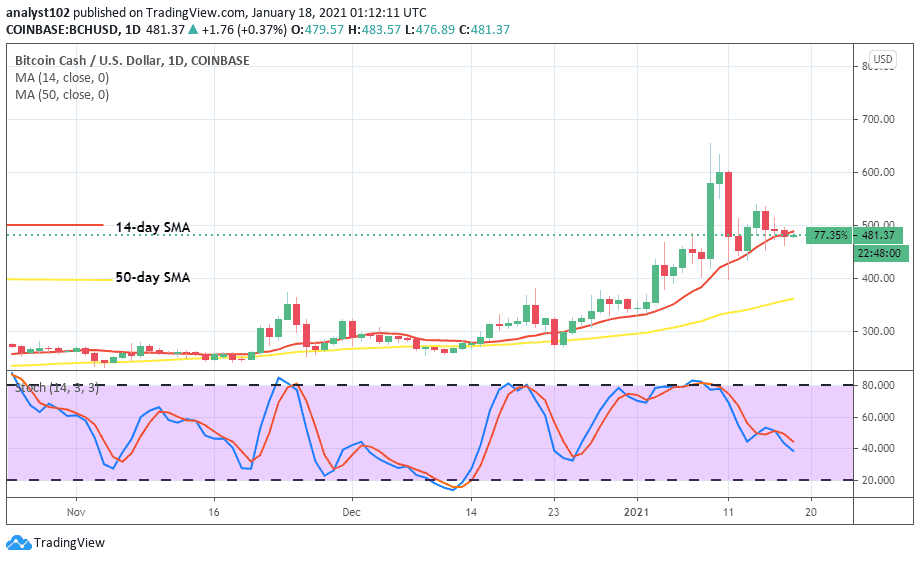
There was a strong-promising buying-signal in the market of BCH/USD while a bullish candlestick occurred slightly northbound of a resistance value at $600. Meanwhile, it was decimated in about two days as price saw a significant downward touching a low line at $400.
Bbbbb BCH/USD Market
Key Levels:
Resistance levels: $600, $700, $800
Support levels: $350, $300, $250
BCHUSD – Daily Chart
There have been ups and downs featuring all on the buy signal side of the smaller SMA trading indicator of 14-value. Price now hovers around the 14-day SMA trend-line around $500 point. The two SMA trend-lines point towards the north-direction as the 50-day SMA is underneath the smaller SMA with a sizeable space between them. The Stochastic Oscillators have moved downward to find a place between ranges of 60 and 40. And, now seemingly getting set to commence a consolidation-moving pattern in a near time around the two mentioned earlier.
What could be the next price direction for BCH/USD?
Presently, in the meantime, the BCH/USD market operations are witnessing a short-line of range price movements around $500. That suggests the crypto-market is in somewhat indecision trading sessions. Bulls may as well not be pushing northward sustainably beyond the immediate resistance level at the $600 line in the next sessions.
On the downside, the Jan. 11 bearish candle-stick that emerged could serve as a selling-wall for bears to be on the lookout for placing their entry while a weakness is noticed in the bulls’ attempting moves especially, out of the specified range trading zone. The trade-value at $400 may also be a strong base-line for bearish moves rejection area that bulls could, in the long run, take advantage.
BCHBTC Price Analysis
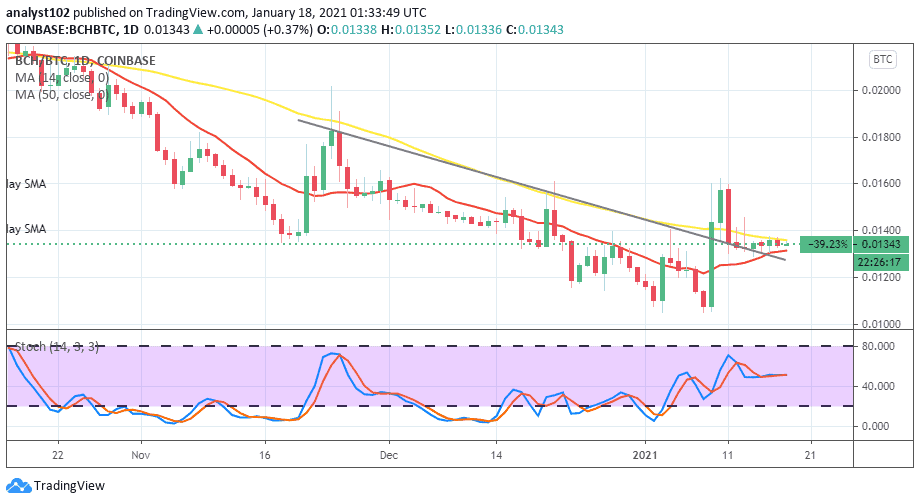
In a comparison of BCH to BTC market movements, the base crypto-instrument hasn’t had it smoother than its counter crypto as it hasn’t been able to change the trend far from bearish outlook. Trading indicators are almost closer with featuring different small buying and selling candlesticks at a low level of B0.014 mark. A price consolidation is most likely to surface between the two market-tools in the next trading sessions around the value mentioned earlier. Meanwhile, a forceful downward pressure could lead to the trading instrument to average a lower value below B0.010.
Join Our Telegram channel to stay up to date on breaking news coverage


