Join Our Telegram channel to stay up to date on breaking news coverage
BCH Price Prediction – March 30
Bitcoin Cash (BCH) is following bullish sentiment as the daily chart reveals while the sellers are waiting to scalp gains from potential pullbacks.
BCH/USD Market
Key Levels:
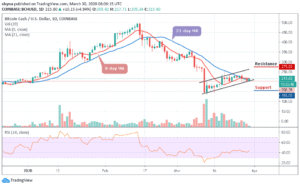
Resistance levels: $275, $295, $315
Support levels: $155, $135, $115

BCH/USD went up slightly from $202 to $215 in the early hours of today. Over the past few days, BCH/USD has been following a downward movement within the ascending channel and will look to gain momentum after bouncing up from the upward trending line. However, despite all this, the RSI is hovering around 42.58, as BCH/USD faces the upward movement.
Looking at the daily chart, BCH/USD is changing hands at $215.60 and if the market price drops further, the coin could slump below the 9-day and 21-day moving averages which may likely reach the support levels of $155, $135 and $115, after the price has crossed below the channel. Meanwhile, a strong buying pressure may continue to push the price to the resistance level of $240.
However, while trading at $250, a bullish continuation may likely push the price to $275, $295 and $315 resistance levels. Regardless of the above, BCH/USD is considered bullish as the technical indicator RSI (14) is moving towards the north.
Meanwhile, against BTC, when looking at the daily chart, following the trade for the past few weeks, the bulls have shown a great commitment to BCH trading. More so, by following the recent positive sign, the trend may continue to go up if the buyers can sustain the pressure further.
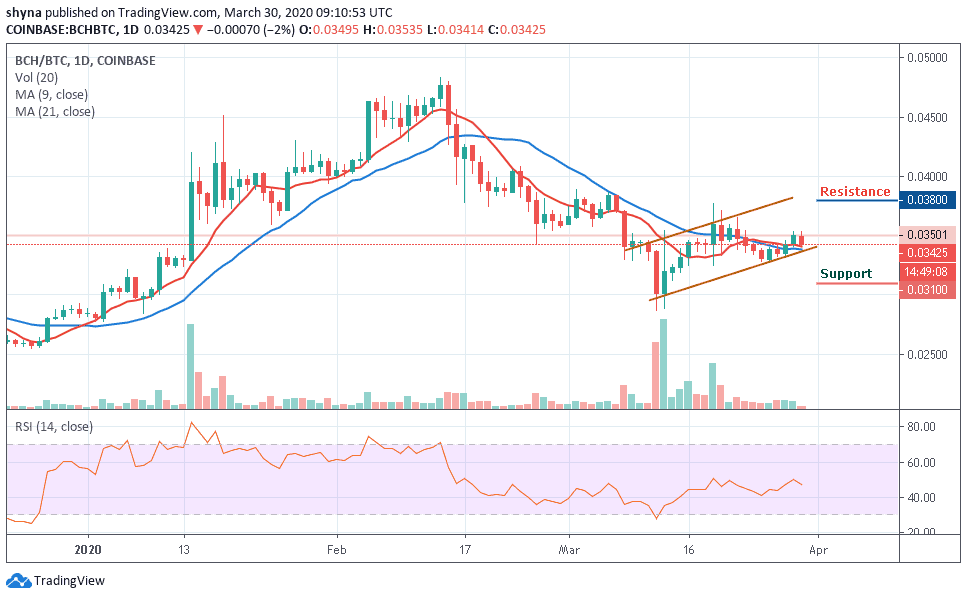
However, if the bulls succeeded in breaking the upper side of the channel, the market price may likely reach the next resistance level of 3800 SAT and 4000 SAT. In other words, a retest could allow the pair to go below the 9-day and 21-day moving averages that may lower the price to 3100 SAT and 3000 SAT support levels. With the look of things, the RSI (14) faces the south which may likely fall slightly before moving higher.
Please note: Insidebitcoins.com is not a financial advisor. Do your research before investing your funds in any financial asset or presented product or event. We are not responsible for your investing results.
Join Our Telegram channel to stay up to date on breaking news coverage