Join Our Telegram channel to stay up to date on breaking news coverage
Bitcoin Cash Price Prediction – January 23
According to the daily chart, the Bitcoin Cash price prediction shows that BCH is seen moving below $300 as the coin ready to fall more.
BCH/USD Market
Key Levels:
Resistance levels: $350, $370, $390
Support levels: $220, $200, $180
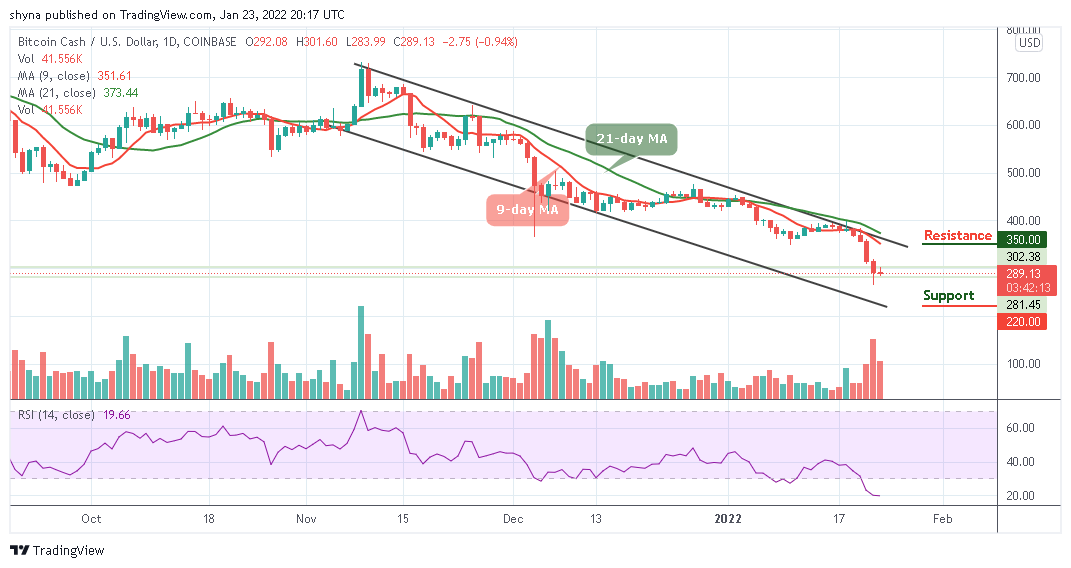
BCH/USD is experiencing a downward as the coin remains below the 9-day and 21-day moving averages. However, the Bitcoin Cash price is seen heading towards the south, but the bulls are keen to ensure that the price stays back above $300. Moreover, today’s dips could go towards the lower boundary of the channel to test the support level of $250.
Bitcoin Cash Price Prediction: Bitcoin Cash Price Could Stay within the Negative Side
During the European session today, the Bitcoin Cash price touches the daily high of $301.60 level, but it has not been able to move to the positive side before it begins to recede downwards. Now, BCH/USD is moving below the 9-day and 21-day moving averages but with all indications, it is possible for BCH/USD to fall more before the day runs out as the Relative Strength Index (14) may remain within the oversold region, suggesting more bearish signals.
Moreover, if the market drives below the $250 support, the Bitcoin Cash price could slump to the support levels of $220, $200, and $180, bringing the price to a new monthly low. Meanwhile, if the bulls can hold the support at the current market value and push the coin to the north, a strong buying pressure may likely take the price to cross above the upper boundary of the channel. While trading at this level, a bullish continuation could hit the resistance levels of $350, $370, and $390.
When compares with Bitcoin, the daily chart reveals the Bitcoin Cash price is likely to cross below the lower boundary of the channel if the bears turn strong, sellers may expect the market price to hit the support level of 750 SAT and below.
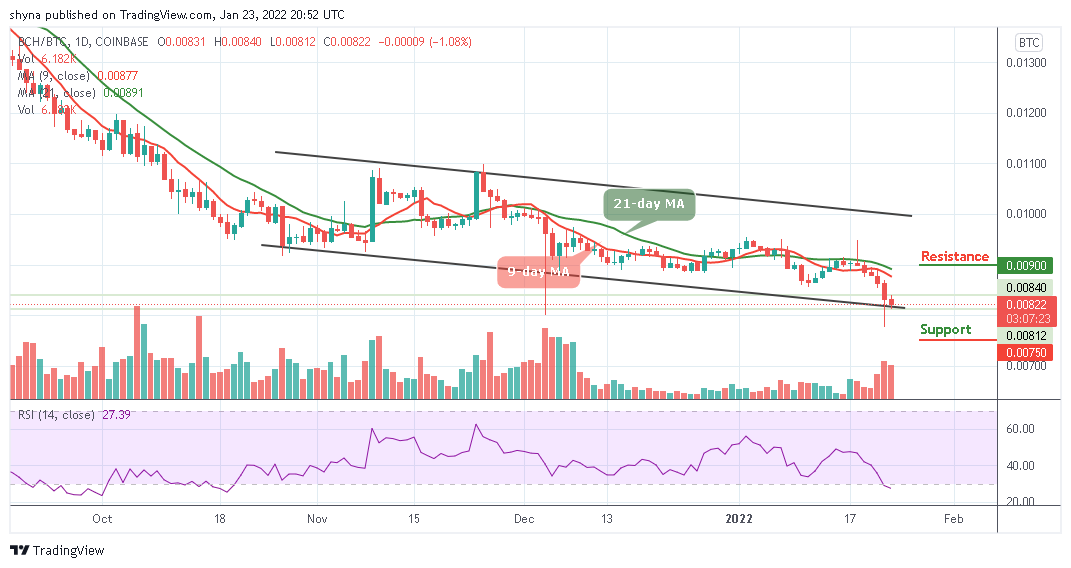
On the other hand, the 900 SAT and above may likely produce resistance for the market should in case the buyers push the price towards the north. However, BCH/BTC pair may continue to follow the downward trend as the technical indicator Relative Strength Index (14) moves into the oversold region.
Looking to buy or trade Bitcoin Cash (BCH) now? Invest at eToro!
68% of retail investor accounts lose money when trading CFDs with this provider
Read more:
- How to buy Bitcoin Cash
- How to buy Cryptocurrency
Join Our Telegram channel to stay up to date on breaking news coverage