Join Our Telegram channel to stay up to date on breaking news coverage
Litecoin Price Prediction – January 23
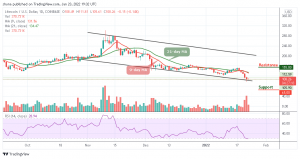
As the daily chart shows, the Litecoin price remains below the moving averages following the current bearish action in the market.
LTC/USD Market
Key Levels:
Resistance levels: $155, $165, $175
Support levels: $65, $55, $45

The daily chart reveals that LTC/USD has been recording some losses since the last few days as the coin begins to follow the bearish trend focusing on the downtrend. At the moment, the Litecoin price is currently trading below the 9-day and 21-day moving averages likely to cross below the lower boundary of the channel.
Litecoin Price Prediction: Litecoin (LTC) Ready for More Downs
The Litecoin price is likely to break more downtrends as the coin fails to recover towards the north. Therefore, the more likely it falls, the more the traders may see the coin falling to a new trading low. A break below the $100 support level may bring the coin below the lower boundary of the channel. However, the technical analysis reveals that the coin is likely to locate the supports at $65, $55, and $45 if crosses below the channel.
On the other hand, a break above the moving averages may cause the Litecoin price to move towards the nearest resistance level of $150 while a further push could take it to the resistance levels of $155, $165, and $175. Now, the technical indicator Relative Strength Index (14) heads to the oversold region, staying there may cause the market to experience another deep fall.
Comparing with BTC, the Litecoin price continues to face the downtrend within the channel, especially since the past few days. The coin remains below the 9-day and 21-day moving averages as the market price falls through subsequent support level to 3012 SAT. The critical support level is located at 2700 SAT and below.
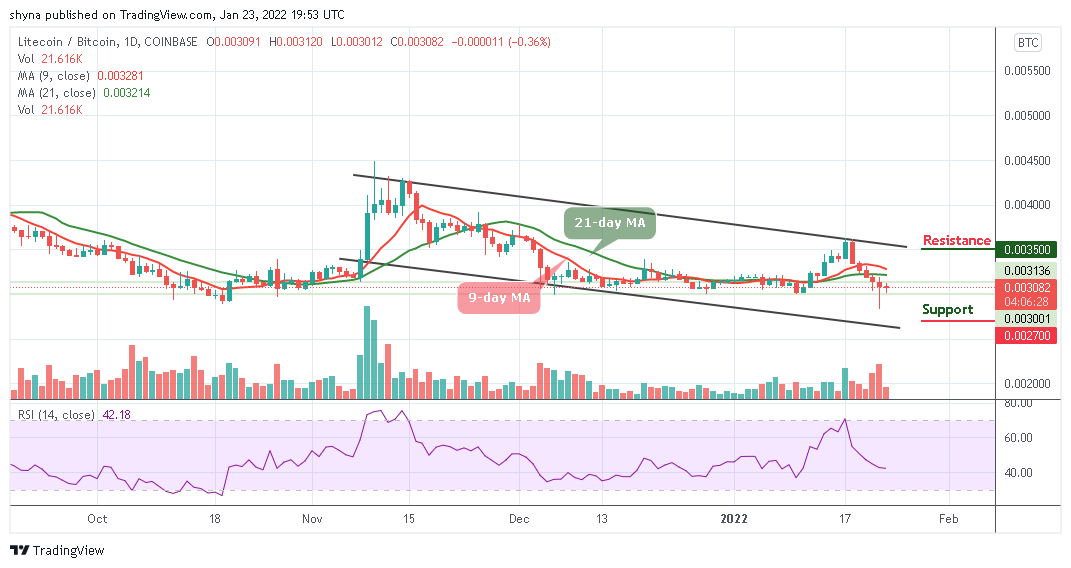
However, if the bulls manage to power the market, traders may likely cross above the moving averages to find the resistance level at 3500 SAT and above. Meanwhile, the Litecoin price is currently changing hands at 3082 SAT but a surge in volatility may occur as the technical indicator Relative Strength Index (14) moves to cross below 40-level, which suggests that more bearish signals may play out.
Looking to buy or trade Litecoin (LTC) now? Invest at eToro!
68% of retail investor accounts lose money when trading CFDs with this provider
Join Our Telegram channel to stay up to date on breaking news coverage