Join Our Telegram channel to stay up to date on breaking news coverage
BCH Price Prediction – November 16
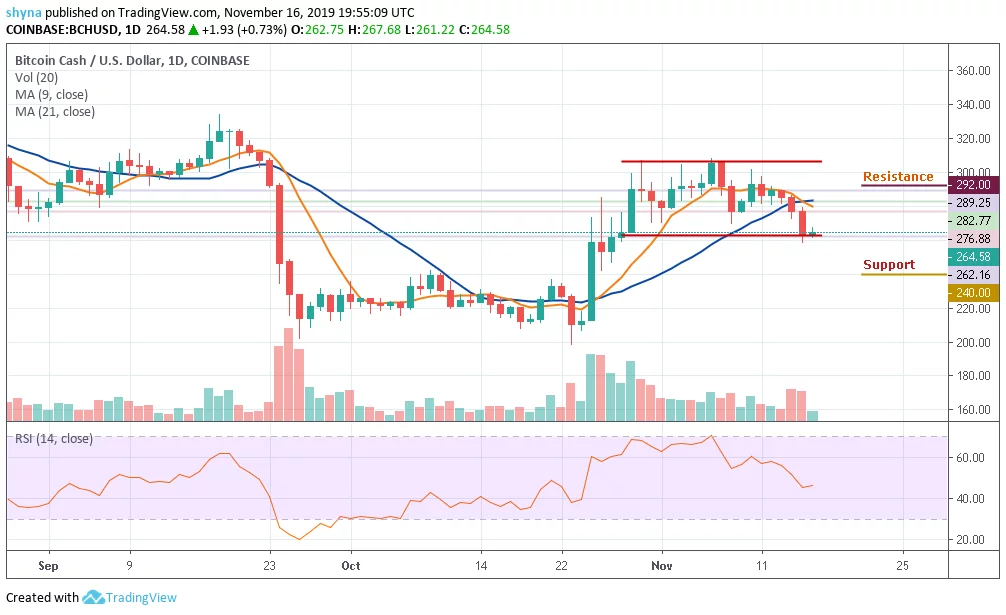
BCH/USD trades at the lowest price in the past 10 days. The coin swings in the strong selling zone and has no grounded support from the short-term moving averages.
BCH/USD Market
Key Levels:
Resistance levels: $292, $302, $312
Support levels: $240, $230, $220
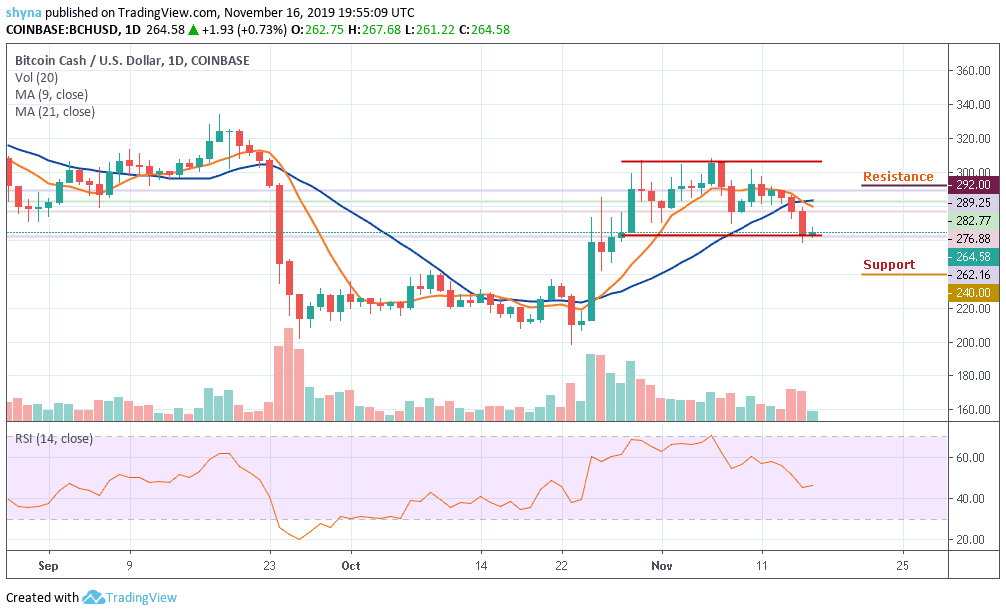
Since the beginning of this week, most of the major coins of the crypto market have been recording losses for quite some time now. Similarly, the BCH/USD price is crashing down even harder as it currently trades at $264.58. The price trend of BCH coin is having more inversely trading red candles leading to loss-making investments.
Meanwhile, analyzing the daily movement of BCH/USD for the past 10 days, we see that the coin has started the month by trading at $282.77, after which it recorded two higher highs constantly. BCH/USD was unable to hold the volatility; the downtrend led the coin to trade at $264.58, recording a fall of 12% from the monthly high price mark of $306.33.
However, BCH/USD is changing hands at $264.58 and if the market price drops further, the coin could slump to the support levels of $240, $230 and $220, bringing the price to a new monthly low. Meanwhile, a strong buying pressure may push the price to the resistance level of $280. While trading at $290, a bullish continuation is likely to touch the $292, $302 and $312 resistance levels
The RSI of the coin is at 45.88 level and could move in sideways before deciding on the next direction.
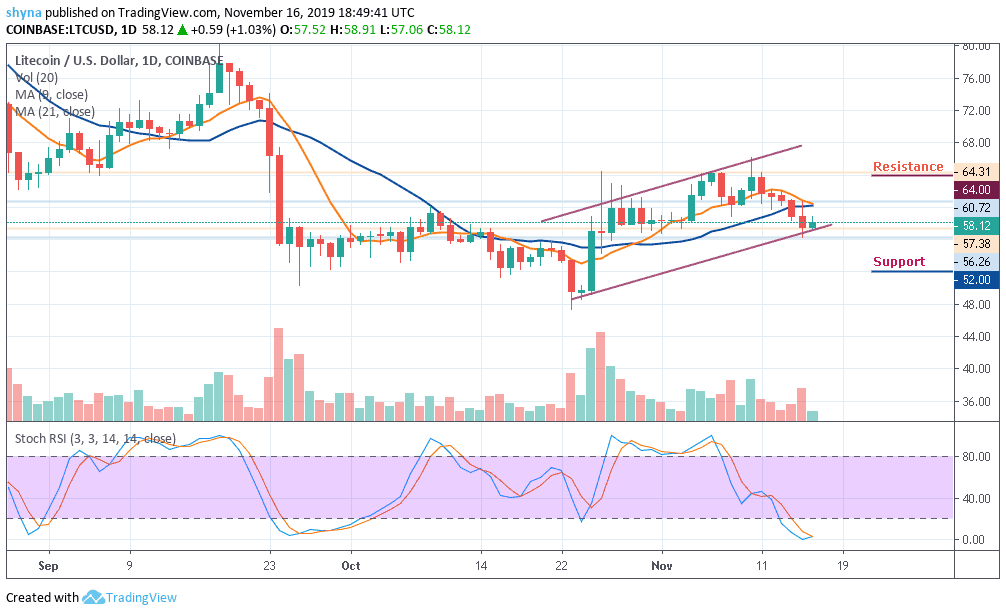
Comparing with Bitcoin, BCH performance has been very low due to a recurring bearish sentiment which has caused the market to fall drastically. As the price falls, sellers are posing an additional threat for buyers to reach the support level of 0.0310 BTC where the nearest target is located. However, an eventual break below the lower side of the channel may cause the coin to collapse more.
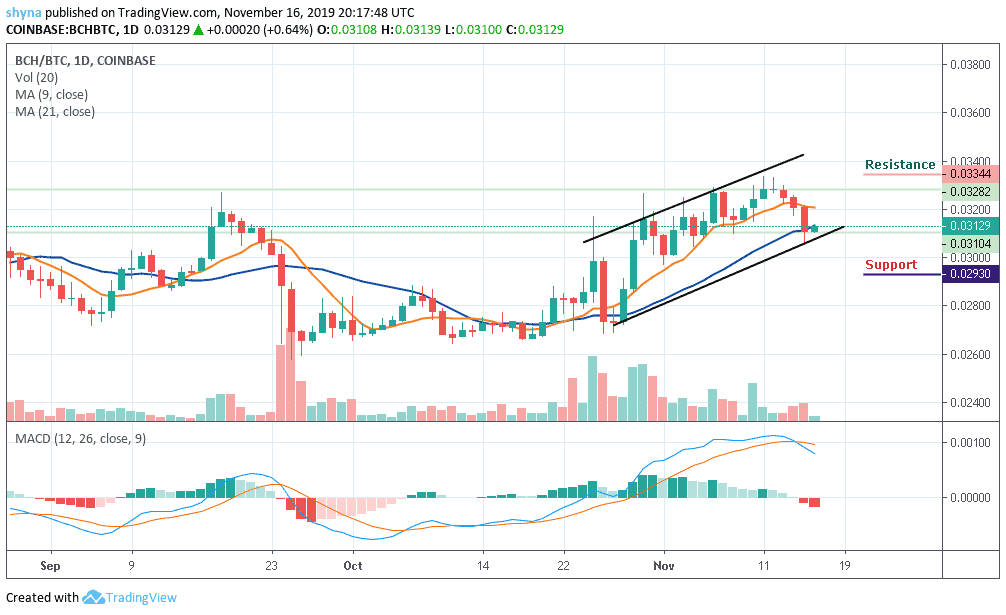
However, for a positive upsurge, the 0.0334 BTC and 0.0344 BTC are the major resistance levels for the coin for now. Therefore, a negative spike could retest the important support at the 00.0293 BTC and 0.0283 BTC before a possible slip to 0.0273 BTC. The trading volume is fading away while the stochastic RSI is entering into the oversold zone, waiting for buying pressure when the indicator faces up.
Please note: Insidebitcoins.com is not a financial advisor. Do your research before investing your funds in any financial asset or presented product or event. We are not responsible for your investing results.
Join Our Telegram channel to stay up to date on breaking news coverage