Join Our Telegram channel to stay up to date on breaking news coverage
Bitcoin (BTC) Price Prediction – September 2, 2020
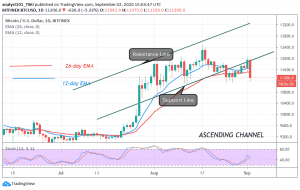
Today, Bitcoin’s price breaks the $12,000 resistance as price reaches a high of $12,060. Buyers failed to sustain the upside momentum. The King coin crashed to $11,200 low. BTC/USD may make a deeper correction.
Resistance Levels: $10,000, $11, 000, $12,000
Support Levels: $7,000, $6,000, $5,000
Since August 17, this will be the second time Bitcoin will be crossing the $12,000 overhead resistance. On August 17, BTC broke the resistance as price rallied to $12,400. Buyers fail to sustain the uptrend as price plunged to $11,200. Today, the same bearish scenario played out itself. Bitcoin crashed to $11,200 but corrected upward. The price was corrected upward and retested the high of $11,500. Unfortunately, the selling pressure may continued.
The bears have succeeded in breaking the $11,600 and $11,400 support levels. BTC is left with the $11,200 crucial support. On the upside, if the $11,200 support holds and price rises above $11,500, another upside momentum has begun. Conversely, if the bears break the $11,200 support and resume the selling pressure, BTC will drop to $11,000 or $10,400. This will portend negatively on the coin. Bitcoin is now trading above $11,300 at the time of writing.
USD Currency Index Aggravates Bitcoin Price
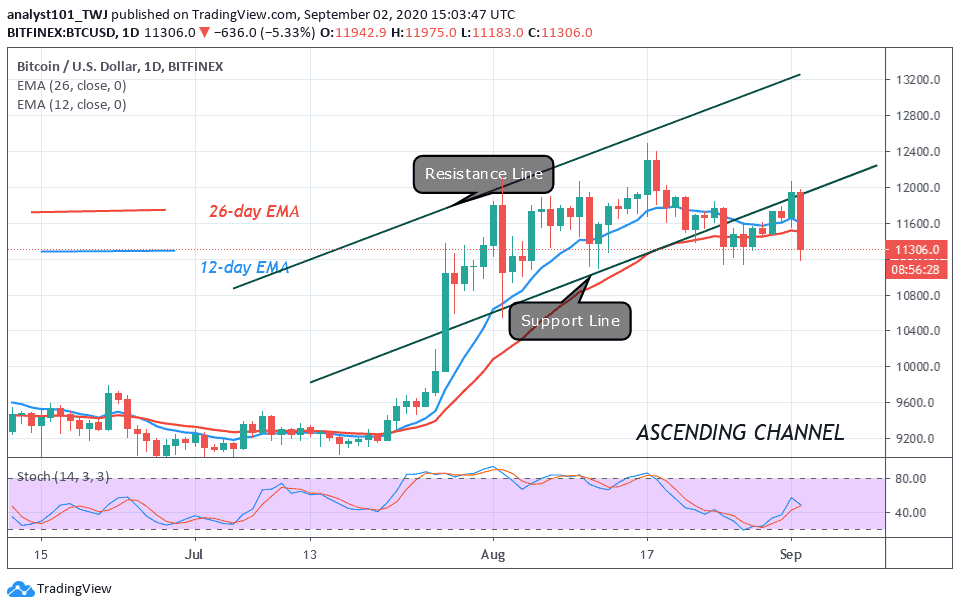
U.S dollar currency index appears to have fresh strength as it causes trouble for BTC price and Gold. Today, Bitcoin fell by 5 % and retested the $11,200 support after facing rejection at the 12,000. According to reports, the crypto currency markets are in for a correction. This recent development was as a result of the index rebounding, putting pressure on BTC and Gold. Gold on its part lost 0.6% to hit a price level of 1957. Today, BTC is gradually recovering as it approaches the high of $11,400.
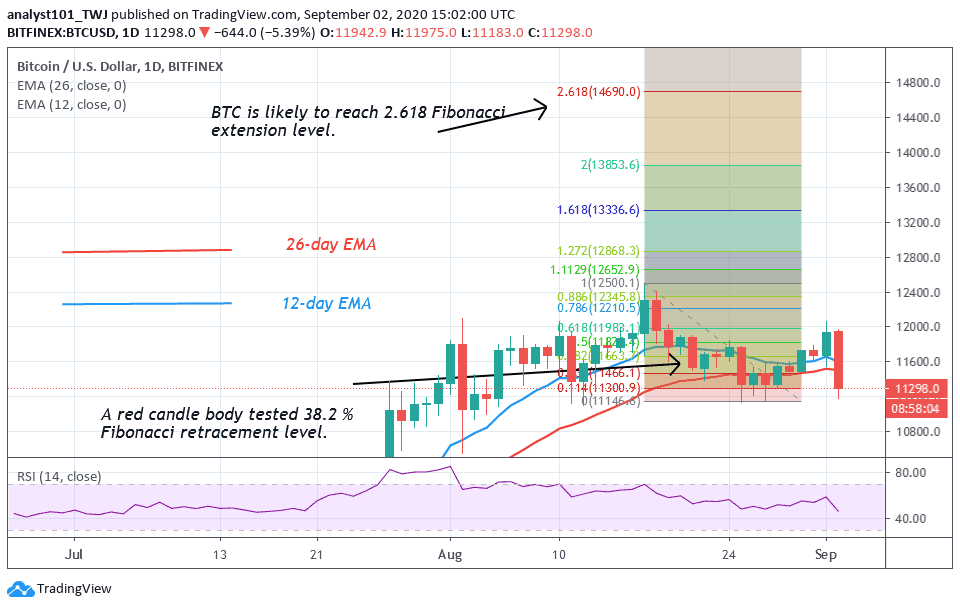
Bitcoin is recovering as it approaches the high of $11,385. The Bitcoin uptrend is intact if the support at $11,200 holds. Nonetheless, the bullish scenario of the Fibonacci tool is still relevant as we await the breaking of the $12,000 overhead resistance. According to the Fibonacci tool, a retraced candle body tested the 38.2% Fibonacci retracement level in the August 17 uptrend. This gives us the impression that the market will rise to 2.618 extension.
Join Our Telegram channel to stay up to date on breaking news coverage