Join Our Telegram channel to stay up to date on breaking news coverage
BCH Price Prediction – September 1
For now, BCH/USD is mainly in the hands of the bulls as they eye action towards the $300 resistance level.
BCH/USD Market
Key Levels:
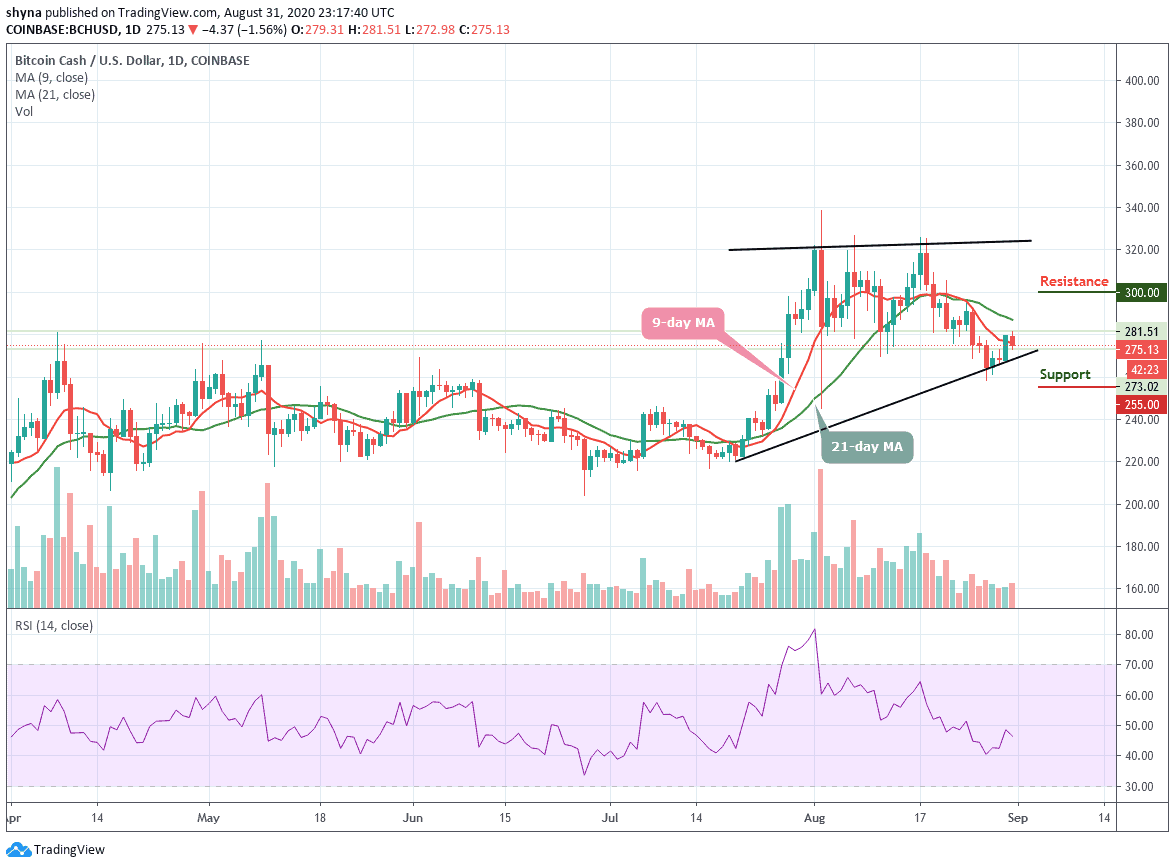
Resistance levels: $310, $320, $330
Support levels: $255, $245, $235
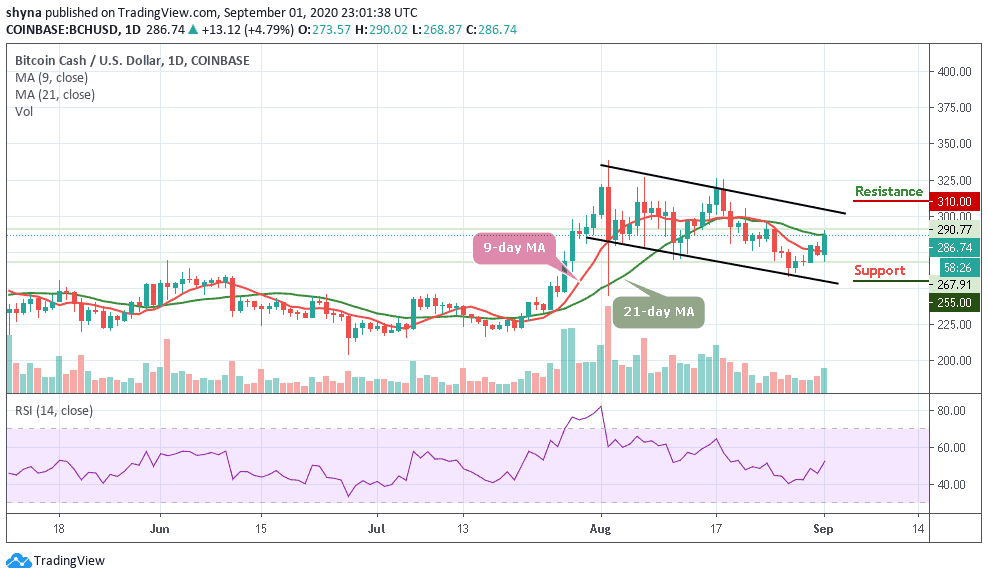
BCH/USD bulls are extending the price action above $285 as the coin hovers at $286.75 at the time of writing. However, the coin is seen focusing on the bullish momentum after a sustainable break above the 9-day and 21-day moving averages. More so, the coin has gained over 4.79% within 24 hours as it is using $265 support as a jumping-off ground to develop the upside momentum, which is now gaining traction.
Where is Bitcoin Cash (BCH) Going Next?
On the upside, if BCH/USD stays above the 9-day and 21-day moving averages, the market price may likely break-through another resistance at $300 and $305 respectively. Meanwhile, the technical indicator shows that the bulls are ready for action especially as the up-trending RSI (14) begins. Any further bullish movement may pave the way to the resistance levels of $310, $320, and 330.
On the other hand, if the price falls below the moving averages, the market may be compelled either to a range-bound or begin a downward movement. This could serve as a major blow for the market sentiments as traders may interpret it as a sign of underlying weakness. The next available support may come at $263, which could be followed by $255, $245, and $235 support levels.
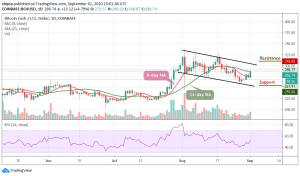
Against BTC, one thing to note here is that the market is preparing to change the trend as the coin remains above the 9-day moving average, a short-term bullish breakout may likely play out because the technical indicator RSI (14) is moving above the average at 46-level. This may likely find the potential resistance level at 0.0250 BTC and above.

However, peradventure the buyers failed to hold the current market price at 0.0241 BTC, it may likely begin a downward movement, but while dropping further could bring the coin below the lower boundary of the channel and to the support level of 0.0220 BTC and below.
Join Our Telegram channel to stay up to date on breaking news coverage