Join Our Telegram channel to stay up to date on breaking news coverage
ETH Price Prediction – September 1
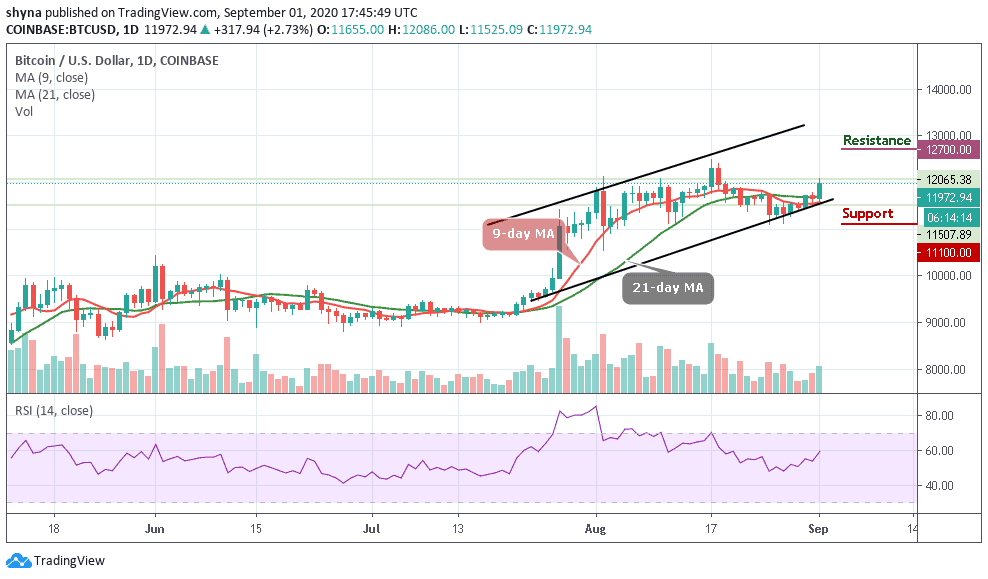
Ethereum (ETH) looks unstoppable, gaining a lot of market dominance over BTC which is struggling to break $12k.
ETH/USD Market
Key Levels:
Resistance levels: $540, $560, $580
Support levels: $390, $370, $350
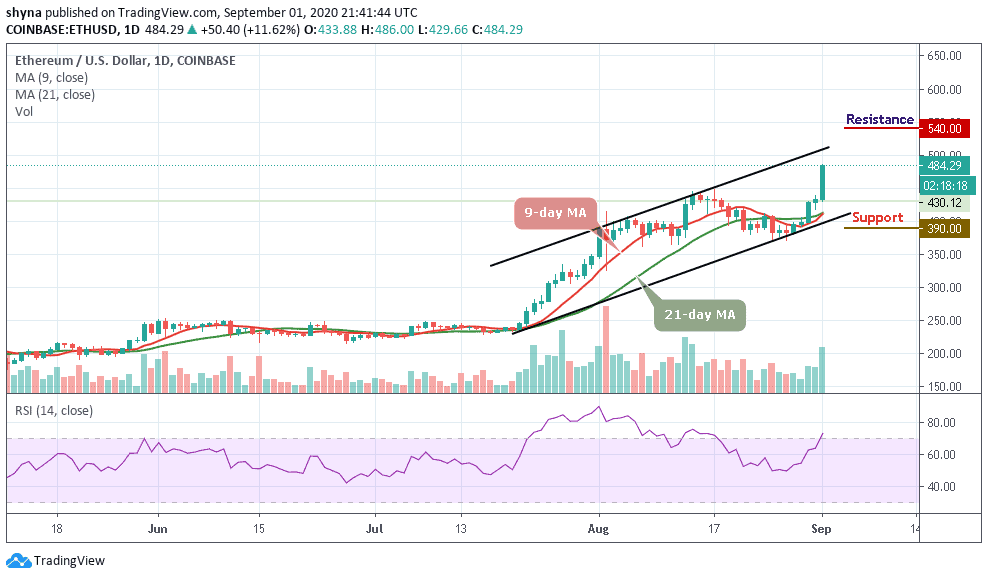
ETH/USD is seen trading at $484 after recording an intraday high at $489 today. ETH/USD is gaining over 11.6% since the beginning of the day and tested $486 for the first time since two years ago. At the time of writing, the second-largest digital asset is changing hands above the 9-day and 21-day moving averages amid strong bullish bias. While the bulls seem to have hit a pause button, for the time being, ETH/USD may be poised for a stronger recovery as several key technical levels are left behind.
Where is Ethereum Price Going Next?
ETH/USD can be expected to rise to $500 over the next few days while the on-going trend may move a little bit higher in the coming days. The Ethereum price may cross above the channel to touch the nearest resistance at $520. Therefore, as the red-line of 9-day MA is about to cross above the green-line of 21-day MA, the coin may continue to do well and the price could hit the resistance levels at $540, $560, and $580 respectively.
Meanwhile, should the technical indicator decide to make a quick turn from the overbought, there may be a cross below the moving averages and the bearish drop could roll the market down to the support levels of $390, $370, and $350 respectively.
Against Bitcoin, as the red-line of the 9-day MA is crossing above the green-line of the 21-day MA, the market price focuses on the uptrend within the channel. ETH/BTC is currently trading at the 4025 SAT and if the market continues to rise, the next key resistance may be at 4300 SAT and above.
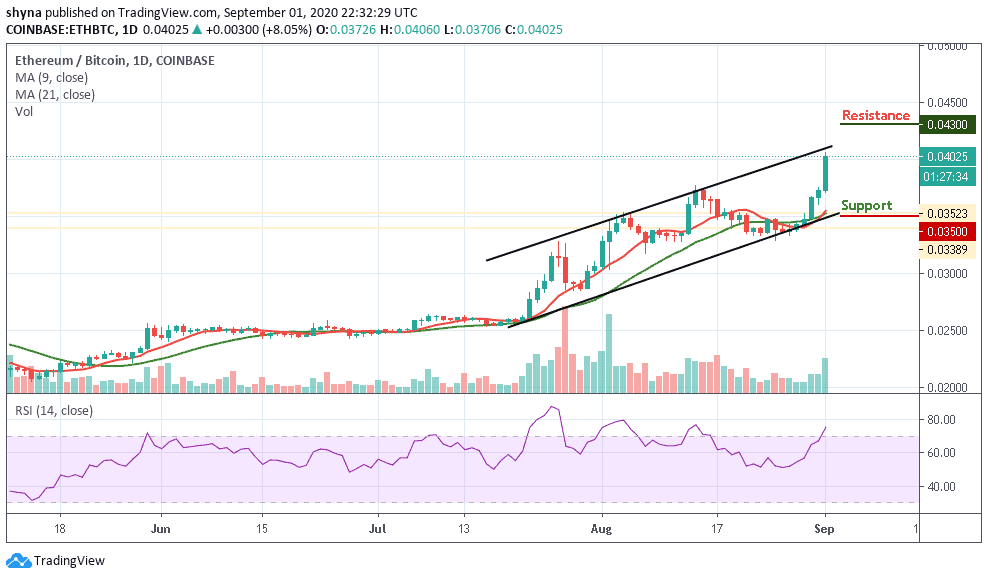
On the downside, a possible bearish movement below the moving averages may likely come into play, when this is done, the support level of 3500 SAT and above could be visited. Meanwhile, the market may continue to have a bullish day today because the RSI (14) indicator is within the overbought, suggesting more bullish signals.
Join Our Telegram channel to stay up to date on breaking news coverage